Figures & data
Figure 1. Deamidation (1a) and Isomerization (1b) reaction mechanisms showing deprotonation (1) of the n + 1 amide leading to the formation of succinimide intermediate (2) and hydrolysis of succinimide (3) into aspartic acid (3a) or iso-aspartic acid (3b).
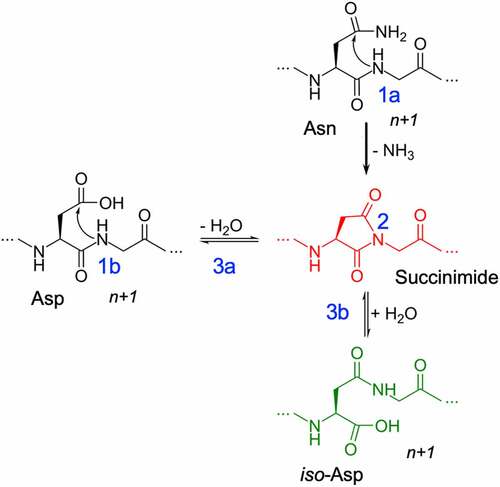
Figure 2. Dependence of proton affinity of small molecule N-formyl-glycinamide on backbone conformation. (a) the deprotonation reaction and calculation of proton affinity as the heat of formation of the forward reaction, (b) the proton affinity distribution of the small molecule N-formyl-glycinamide as a function of the backbone dihedral angles, and (c) the most acidic and basic conformations based on the proton affinity distribution.
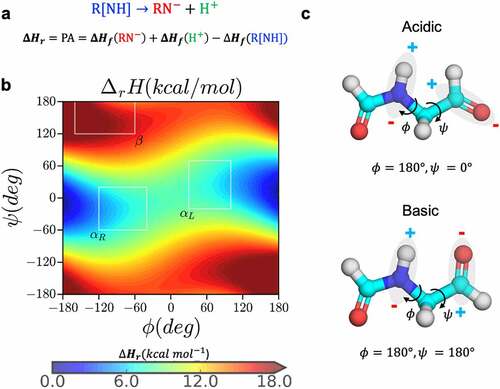
Figure 3. Conformational determinants of proton affinity in NG and NA dipeptides. a) the gas-phase proton-affinity calculated with the semi-empirical PM6 Hamiltonian as a function of ϕ & ψ angles (upper panels) and the kernel density estimation plots of ϕ & ψ angles for the respective NG and NA motifs observed in the PDB database of crystallized antibodies (lower panels). b) Representative conformations and the possible ways in which the values of ϕ & ψ affects proton affinity: beta sheet (b1, basic), right-handed helix (b2, basic), and left-handed helix (b3, acidic).
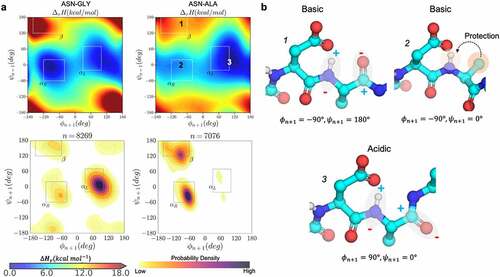
Figure 4. Plots of the normalized probability of secondary structure conformations for NX (upper panels) or DX (lower panels) motifs for antibody structures in PDB (X-axis) and the normalized minimum PM6 proton affinity heat of formation observed in the same region in Y-axis. The yellow boxes show motifs that are likely to adapt the corresponding conformation (X-axis) resulting in a low relative proton affinity. The gray boxes highlight motifs that are less likely to adapt the corresponding conformation but will result in a low proton affinity. The regions outside gray and yellow represent high proton affinity motifs and conformations (less prone to degradation). The residues in the yellow boxes are most often the hot spot residues.
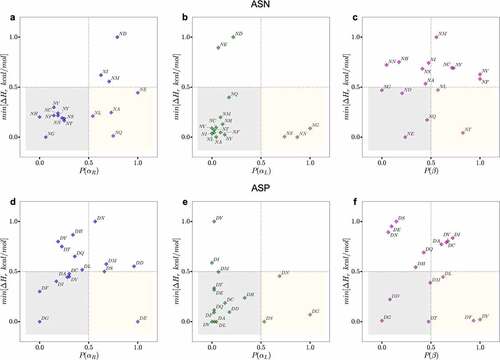
Figure 5. Kernel density estimation plots for the ϕ & ψ dihedral angles populated in MD simulations combined for all 1039 residues that neighbor Asp (top) or Asn (bottom) in the Adimab dataset. The ϕ & ψ angle distributions were collected from μs long equilibrium MD simulations and classified as reactive (left) and non-reactive (right) based on the measurements reported in the Adimab dataset. A clear pattern emerges around the left-handed α-helix conformation in reactive cases that is distinct from the non-reactive cases on the right.
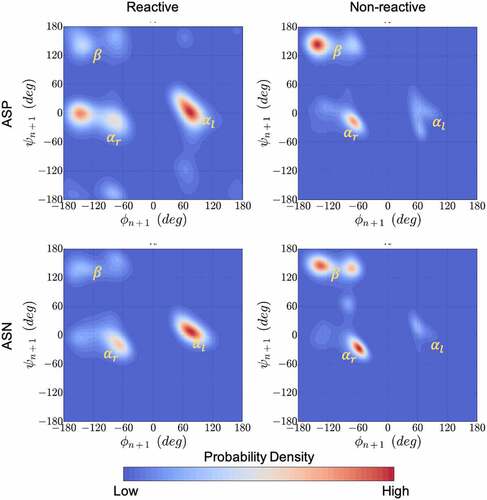
Figure 6. Conformational space that enables near-attack distances increasing the propensity for succinimide formation. a) The structural orientation of the reactive (1a and 2a) and non-reactive (2b and 3) side-chain conformations, characterized by ψ & χ, for an aspartic acid residue shown in ball and stick representation. b) Free-energy surface in the space of ψ & χ dihedral angles and c) the corresponding distance between Cγ and the n + 1 amide nitrogen calculated from metadynamics simulation of Ace-GGNAG-Nme pentapeptide.
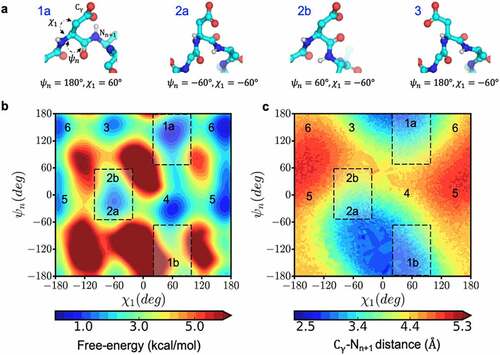
Table 1. Performance analysis for the physics-based classifier model using different combinations of the descriptors: (D1) backbone dihedral conformation of the n + 1 residue, (D2) side-chain dihedral conformation of Asn/Asp residue, (D3) fraction of time the Asn/Asp residue remains solvent accessible. Combinations are represented by DXX where the X represents the descriptors.
Figure 7. Performance of individual descriptors in discriminating degraded Asp (top) and Asn (bottom) residues from the Adimab dataset. The percentage degradation values reported in the Adimab study are represented on the X-axis. The Y-axis in the leftmost panel (D1) is the free-energy barrier at the deprotonation prone backbone helical conformation of the n + 1 residue. The Y-axis in the middle panel (D2) is the free-energy barrier at the near-attack conformation defined by the ψ & χ angles. The Y-axis in the rightmost panel (D3) is the time fraction when the Asp/Asn residue remains solvent accessible. The red cutoff markers indicate the values that determine if a residue is prone to degradation or not. The blue shaded regions indicate the false negative predictions (experimentally observed to degrade but classified as non-reactive) and the gray shaded region indicates the false positives (predicted reactive but not evidenced experimentally).
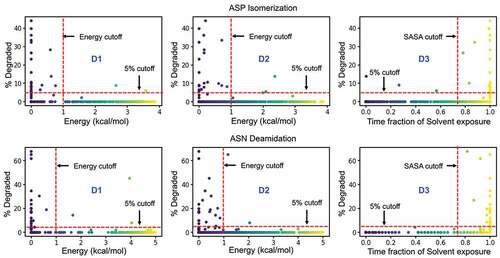
Figure 8. Flowchart showing the decision scheme used to determine if a given Asn/Asp residue is likely to degrade in folded proteins.
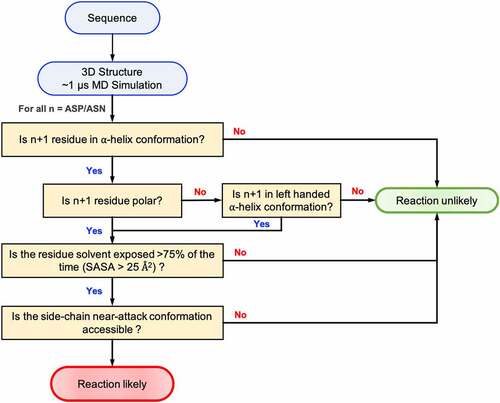
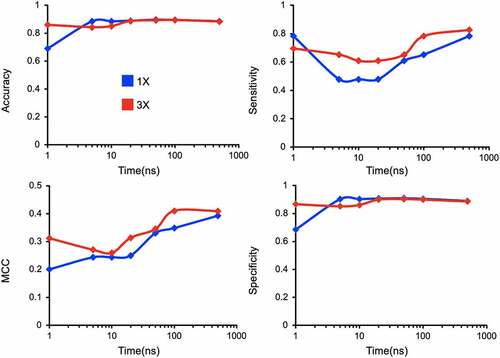
Figure 9. Assessing sensitivity of model accuracy to the variations in simulation length (1–500 ns) and replicas (1 and 3).