Figures & data
Table 1 Comparison of clinical ADA rates and experimental in vivo immunogenicity of 13 selected human IgG1 clinical mAbs. Table 1 lists the 13 clinical mAbs with reported clinical ADA rates and experimental in vivo immunogenicity (Incidence; IGF) observed in hIgG1 transgenic (TG) and wild-type (WT) mice. In addition, the target, format, and highest V gene identity to the closest VH and VL gene of the transgene or germline is indicated in percent.
Figure 1. Low identity of antibody V genes to endogenous V genes does not correlate with increased immunogenicity. V gene identity is given as percent amino acid sequence identity of the variable (V) domain of each antibody listed with the best matching hIgG1 transgenic (TG, orange circles) or endogenous murine wild-type (WT, gray circles) V heavy (VH, left panel) and V light (VL, right panel) gene elements. The Immunogenicity Factor (IGF) as a degree of immunogenicity is correlated with the V gene identity for hIgG1 transgenic (orange lines) or wild-type mice (gray lines) and R2 values, as well as p-values are displayed in the plot. A robust linear model was used, based on Huber’s M-estimator, which downweighs the influence of single outlying data points, as well as deviations from non-normality. R2 coefficients of determination were calculated using modified residual and total sums of squares, i.e., weighing the squared deviations with the respective weights assigned by the robust estimator. Compounds showing higher identity to endogenous V genes compared to transgenic V genes are labelled and in addition, chimeric compounds are labelled in blue.
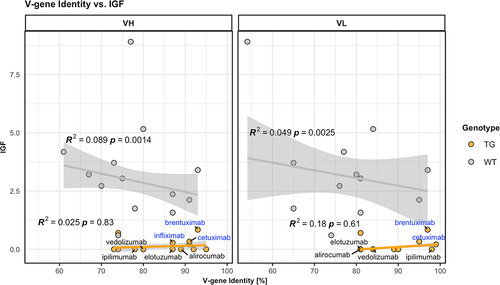
Figure 2. Fc contributes to the unresponsiveness towards conventional mAbs. Murine IgG anti-drug antibody (ADA) titers in hIgG1 transgenic (orange, upper panels) and wild-type (gray, lower panels) are measured over time before (day 0) and after the first immunization. Groups of 10 hIgG1 transgenic and 10 wildtype mice were immunized with the full antibody and the respective Fab preparation in the same experiment. The immunization compound (I:) and the coating compound for the ELISA (C:) are displayed above each plot. ADA titers above the arbitrary threshold of 200 are considered as positive and hence used to calculate the ADA incidence displayed in percent and the Immunogenicity Factor (IGF). Panel A) displays ADA titers against the full IgG1 antibodies bevacizumab, CEA-IgG, DP47-IgG and panel B) shows ADA titers against the respective Fab fragments beva.-Fab, CEA-Fab, and DP47-Fab. Panel C) shows ADA titers against the Intravenous Immunoglobulin subclass 1 Fab fragment (IVIG1-Fab) induced by immunization with the full IVIG1 or IVIG1-Fab preparation.
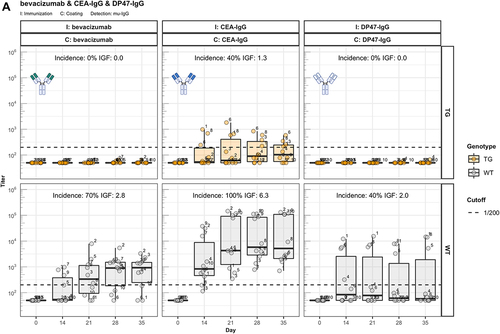
Figure 2. (Continued).
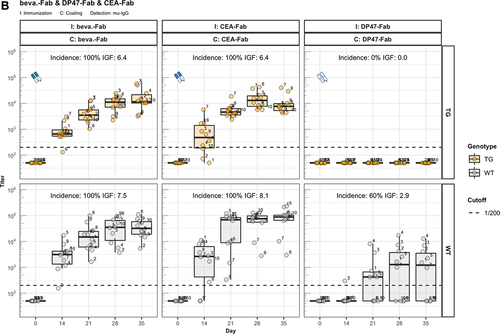
Figure 2. (Continued).
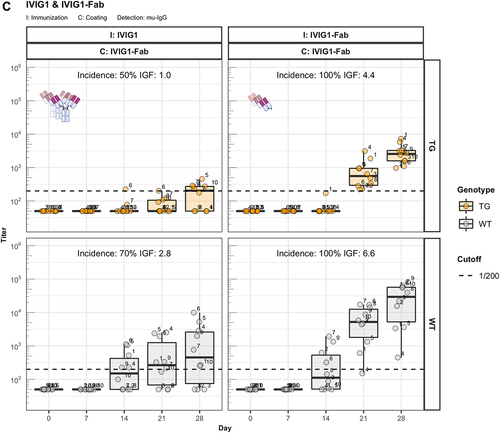
Figure 3. The role of FcRn in immunogenicity. Murine IgG anti-drug antibody (ADA) titers in hIgG1 transgenic (orange), wild-type (WT, gray) and FcRn-KO (blue) mice are plotted over time before (day 0) and after the first immunization. For each immunization, groups of 10 mice were used. The immunization compound (I:) and the coating compound for the ELISA (C:) are displayed above each plot. ADA titers above the arbitrary threshold of 200 are considered as positive and hence used to calculate the ADA incidence displayed in percent and the Immunogenicity Factor (IGF). Panel A) shows the ADA response of 10 hIgG1 transgenic and 10 wild-type mice immunized with a CEA-mIgA against the full molecule (C: CEA-mIgA), the variable domain (C: CEA-Fab) or the constant region (C: DP47-Fab). Panel B) shows ADA responses against the CEA-binder in 10 hIgG1 transgenic and 10 wild-type mice immunized with CEA-mIgG and CEA-mIgG-AAA. In panel C), FcRn-KO and wild-type mice were immunized with CEA-mIgG and KLH. The immunization with CEA-mIgG was repeated to confirm the result leading to the duplicated sample size (n=20 each).
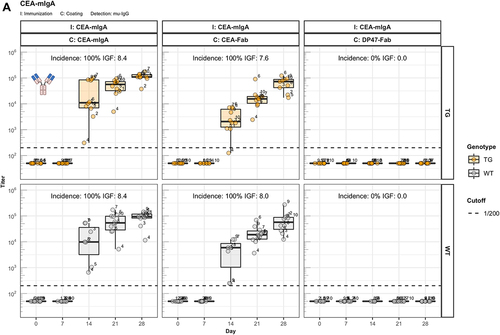
Figure 3. (Continued).
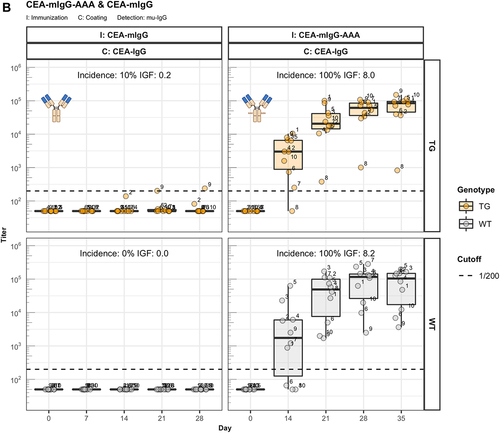
Figure 3. (Continued).
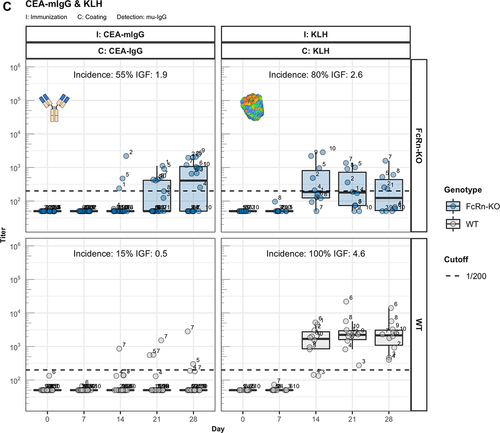
Figure 4. The enhanced immunogenicity of CitAbs. Panel A) ADA response of hIgG1 transgenic mice (TG, orange, n=10) immunized with either CEA-IgG, CEA-hTCB, CEA-mTCB or CEA-IL2v against the scaffold antibody (CEA-IgG) or the injected compound (CEA-hTCB) is shown. Panel B) shows the specific ADA response of hIgG1 transgenic mice (orange, n=10) immunized with either CEA-IL2v directed against the scaffold antibody (CEA-IgG), the F(ab’)2 fraction (CEA-Fab2) and the Fc domain (Fc-PGLALA). Panel C) depicts the specific ADA response of hIgG1 transgenic mice (orange, n=10) immunized with either CEA-IL2v (as in A)) or DP47-IL2v directed against the scaffold antibody, CEA-IgG or DP47-IgG, respectively. Panel D) shows the specific ADA response of hIgG1 transgenic mice immunized with CEA-mTCB or DP47-mTCB specific for the parental molecule or the murine CD3 binding moiety (mCD3-IgG).
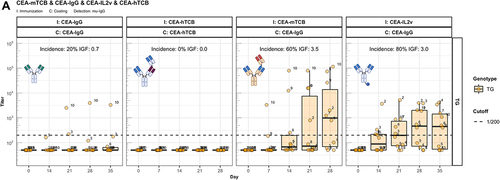
Figure 4. (Continued).
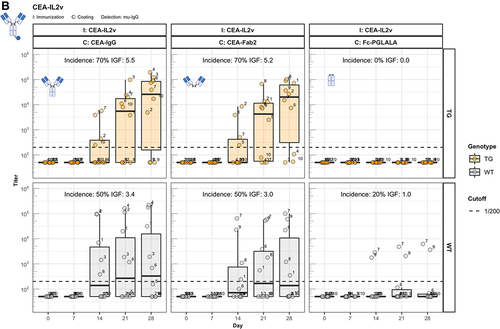
Figure 4. (Continued).
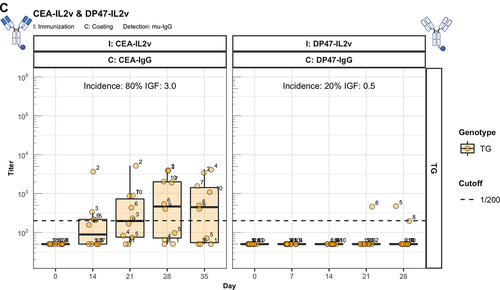
Figure 4. (Continued).
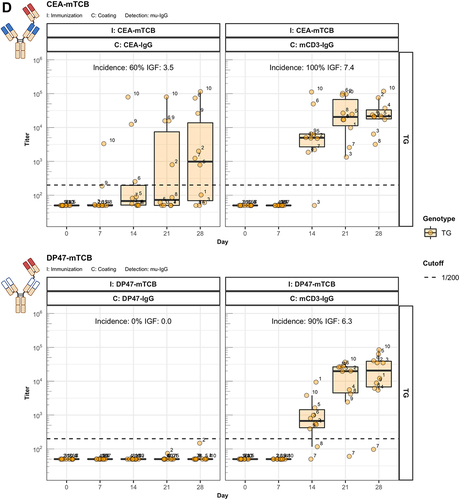
Figure 5. IC formation leads to slightly enhanced immunogenicity. Panel A) shows murine IgG ADA titers against the scaffold antibody (CEA-IgG) of hIgG1 transgenic (TG, orange, n=10) and wild-type (WT, gray, n=10) mice immunized with either CEA-IgG or CEA-IgG in immune complex with a mouse IgG2a anti-idiotype (CEA-IgG-IC). Panel B) displays the internalization rate of compounds with a pH sensitive labelling into the acidic lysosome of CD11c+/CD11b+ DCs cultivated from bone marrow of three hIgG1 transgenic and three wild-type mice.
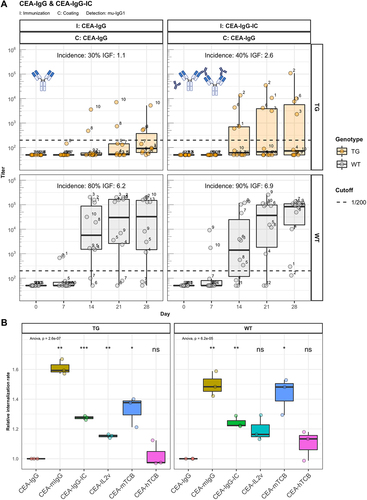
Figure 6. ADA responses to CitAbs require MHC-II dependent T/B collaboration. Panel A) Graphical abstract of the generation of bone marrow chimeric mice using JhT−/−, MHC-II−/− and WT mice. Panel B) Representative FACS plots showing the MHC-II expression on B cells and DCs in spleens of WT BMC and MHC-II KO BMC on day 28. Panel C) Quantification of key populations as shown in Panel B). Mean frequencies for each population are given above the bar. Panel D) ADA response induced by CEA-IL2v and CEA-mTCB in WT BMC (gray) and MHC-II KO BMC (blue). The ADA response against the parental CEA-IgG molecule and the ADA response against the T cell binding moiety is shown for CEA-IL2 and CEA-mTCB, respectively. I: Immunization; C: Coating; D: Detection
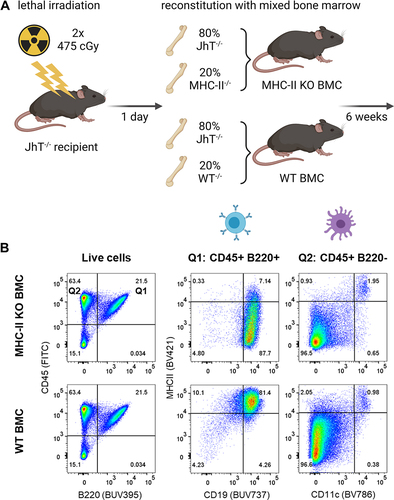
Figure 6. (Continued).
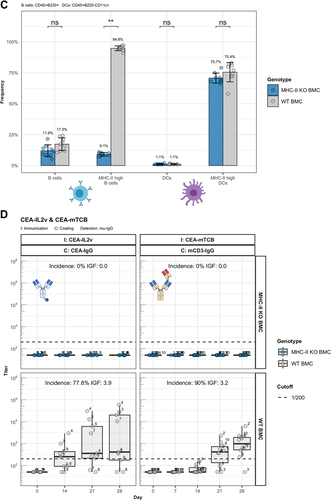
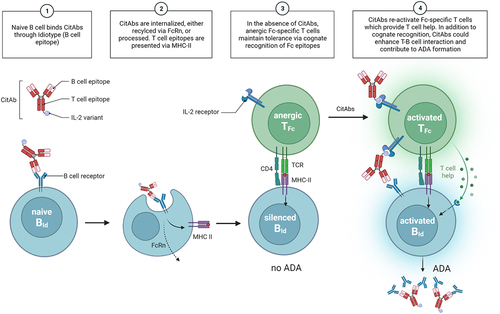
Figure 7. Mechanistic model. A graphical summary of how CitAbs can lead to the break of antigen-linked tolerance and formation of ADA response. Adapted from the figure template “B Cells Internalize and Process Antigens Only if Their BCR is Specific to the Antigen”, by BioRender.com (2022). Retrieved from https://app.biorender.com/biorender-templates