
Figures & data
Figure 1. Overview of animal experiments and analytical workflow.
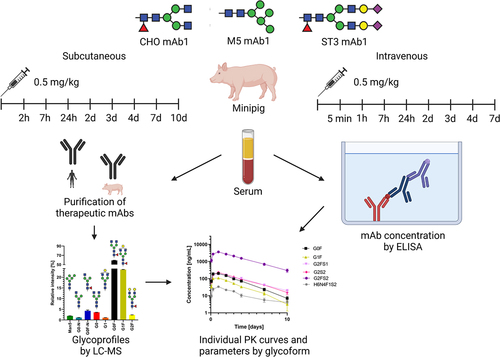
Figure 2. Relative abundance of quantified glycoforms in the mAb1 starting materials. For respective information on mAb2, see Figure S1. Further information on glycoform nomenclature can be found in Table S1.
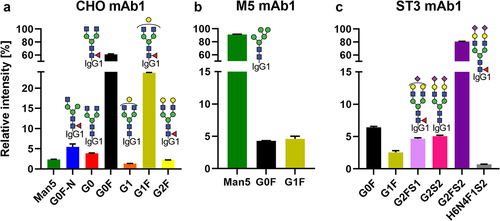
Figure 3. Clearance of the individual glycoforms of the three mAb1 glycovariants, normalized to the clearance rate of G0F in each animal. Mean and 95% confidence interval are depicted; n = 5. Standard deviation ranged from 0.9% to 23%.
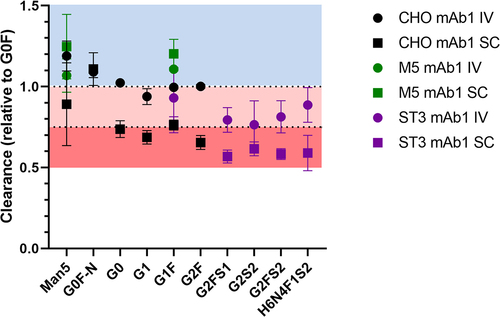
Table 1. Absolute clearance values per glycoform for the three mAb1 glycovariants in IV and SC. Importantly, absolute clearance values should not be compared between different mAb1 preparations due to the effects of glycan pairing.
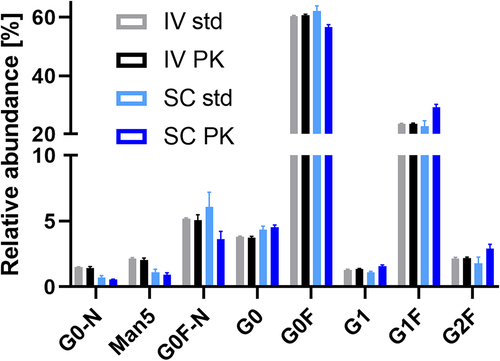
Figure 4. Comparison of the serum profile of CHO mAb1 after intravenous and subcutaneous injection at 24 h (cmax for SC; all samples and standards had concentrations of ca 5 μg/mL total mAb1). Glycoforms, where IV PK differs from SC PK, but not IV std from SC std, are indicated (*p > .01; **p > .001; ***p > .0001). Galactosylation was significantly increased in the SC profiles compared to the IV profiles. Mean and standard deviation are depicted; IV and SC std n = 3, IV and SC PK n = 5.
Supplemental Material
Download Zip (1.2 MB)Data availability statement
IgG Fc N-glycan profiles and ELISA-based concentrations can be found in the supplementary information files (Table S2, S3 and S12). All analyses in this study are based on these values.