Figures & data
Figure 1. CZE electropherograms of the isolated crizanlizumab variants. Crizanlizumab isoforms were enriched using anion exchange chromatography (AEX) fractionation from stressed (40°C for 6 weeks at pH 5.7) and unstressed material (stored frozen at pH 5.7). The fractionation was done with an Agilent HPLC system 1100 equipped with a cooled fraction collection unit and a weak anion exchange column (Dionex ProPac WAX-10 BioLC, 4 mm x 250 mm). Separation of the isoform was achieved using a NaCl salt gradient at pH 7.9. Fractions were diluted (50%: 50%) in citrate buffer (5 mM, pH 2.8) in order to preserve the stability of the basic variants. The collected fractions were concentrated in centrifugal filter devices (15 ml capacity). The final protein content determination was performed by UV spectroscopy (using Nanodrop). The CZE analysis of the AEX fractions was performed using a Beckman Coulter PA800 Plus capillary electrophoresis instrument equipped with an uncoated fused-silica capillary. Electrophoresis was performed in running buffer (400 mM 6-aminocaproic acid/acetic acid pH 5.7 with 2 mM TETA and 0.03% Tween 20) at a constant voltage of 20 kV in positive to negative (normal) polarity mode for 45 or 30 minutes. AP: acidic peak; BP: basic peak.
Figure 2. Analysis of isolated charge variants of crizanlizumab by Lys-C peptide mapping at pH 7.5. A: Extracted ion chromatograms of the iso-aspartic acid and aspartic acid precursor (863.72 m/z) in blue and of the succinimide precursor (857.72 m/z) in Orange of the L2-3 peptide in each fraction acquired with the Orbitrap Elite after peptide separation on the Vydac C18 column. The iso-aspartic acid, aspartic acid and succinimide charge variants are eluting at 52.1, 52.8 and 53.0 min, respectively. AP: acidic peak; BP: basic peak. D: aspartic acid; isoD: iso-aspartic acid; succi: succinimide. B: Depictions of crizanlizumab containing the basic succinimide or the acidic iso-aspartic acid charge variants of the light chain enriched in each fraction. isoD: iso-aspartic acid; succi: succinimide.
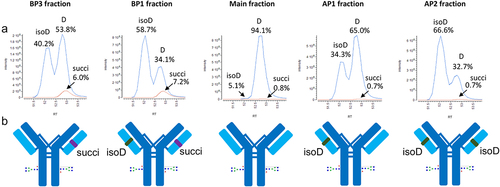
Figure 3. Identification of iso-aspartic acid at position 32 in the CDR region of the light chain of crizanlizumab. Sequence of the peptide L2-3 is shown on top. Zoomed views of ETD MS/MS spectra onto diagnostic ions c + 57 (a) and z – 57 (b) confirming iso-aspartic acid at the DG motif in the peak eluting at 52.1 min (top panel) compared to the peak eluting at 52.8 min (bottom panel) using a Vydac C18 column. C: Identification of the succinimide variant at position 32 in the CDR region of the light chain of crizanlizumab eluting at 53.0 min. Consolidated CID/HCD MS/MS spectra of the unmodified peptide (bottom panel) and the peptide with succinimide at DG motif (top panel). Fragment ions highlighted in red exhibit a loss of 18 Da at the aspartic acid residue corresponding to the succinimide.
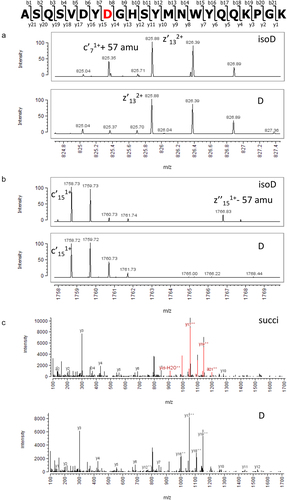
Table 1. Potency of crizanlizumab charge variants. Crizanlizumab charge variants (isoforms) were enriched using anion exchange chromatography (AEX). For peak assignment of the enriched isoforms see and for the identification of the isoforms see . The enriched charge variants were analyzed by ELISA and CBA for potency determination.
Figure 4. Basic variants of crizanlizumab by CZE as a function of time. 10 mg/mL crizanlizumab were compounded at pH 5.0, 5.5, 5.7, 6.0, 6.3, 6.5, 7.0 in parallel and stored at different temperature conditions (5°C, 25°C and, 40°C). Samples were analyzed by CZE at different times to determine the levels of charge variants. A: incubation at 5, 25 and 40°C at pH 5.7, B: incubation at 5, 25 and 40°C at pH 6.0, C: incubation at 5, 25 and 40°C at pH 6.3.
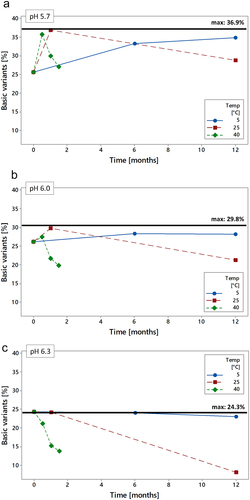
Figure 5. Basic variants of crizanlizumab by CZE as a function of pH. 10 mg/mL crizanlizumab were compounded at pH 5.0, 5.5, 5.7, 6.0, 6.3, 6.5, 7.0 in parallel and stored at 25°C for 1 month. Samples were analyzed by CZE to determine the levels of charge variants.
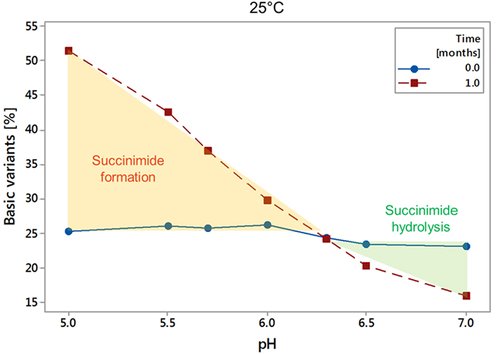
Figure 6. Restoring the biological activity of a stressed crizanlizumab under physiological conditions. The pH of a crizanlizumab sample stressed for 1 month at 25°C, pH 5 was increased to pH 7.4 using NaOH and incubated for 24 hours at 37C. Samples were taken at 0, 0.5, 2, 4, 6.5, and 24 h. Samples were analyzed by CZE, CBA and ELISA to determine the charge variants and biological activity. A: Sample preparation workflow and results from CZE, CBE, and ELISA. B: basic charge variants by CZE over time at pH 7.4 and 37°C. The data was fitted using MiniTab® first-order reaction equation to calculate the half-life.
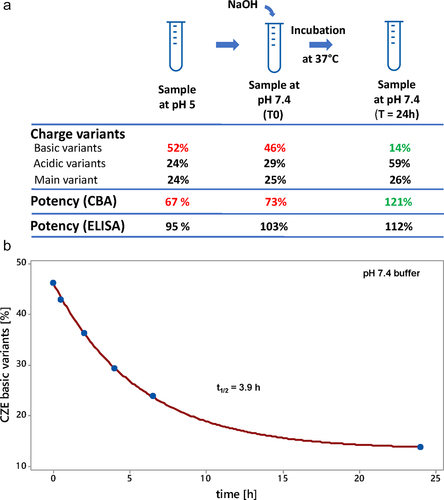
Figure 7. Parallel-reaction monitoring (PRM) of crizanlizumab succinimide conversion in human serum. A: Workflow of the PRM methodology to monitor the succinimide conversion into aspartic acid and iso-aspartic acid over a 24 h time course in human serum. Crizanlizumab stressed for 1 month at 25°C, pH 5 was spiked in human serum at a final concentration of 150 µg/mL and incubated for 0.5, 2, 4, 6.5, 24, and 48 h. Peptide mapping at pH 6 was used to keep the succinimide intact during sample preparation. Targeted L2-3 peptide detection was performed using an Orbitrap Fusion Lumos mass spectrometer and PRM methodology, by acquiring full MS/MS spectra for the succinimide L2-3 precursor at 857.72 m/z aspartic acid and iso-aspartic acid L2-3 precursor at 863.72 m/z in a scheduled method to enhance sensitivity. Multiple fragment ions were monitored for each species to increase the specificity of L2-3 detection in human serum. An example of three specific extracted fragment ion chromatograms is shown for succinimide, aspartic acid and iso-aspartic acid species. succi: succinimide; D: aspartic acid; isoD: iso-aspartic acid. B: Overlay of extracted fragment ion chromatograms for y’172+ for aspartic acid and iso-aspartic acid (blue) and y’172+ - 18 for succinimide (orange) for different time points following the spiking of crizanlizumab in human serum. In-source loss of water for y’172+is observed for aspartic acid and isoaspartic acid species.
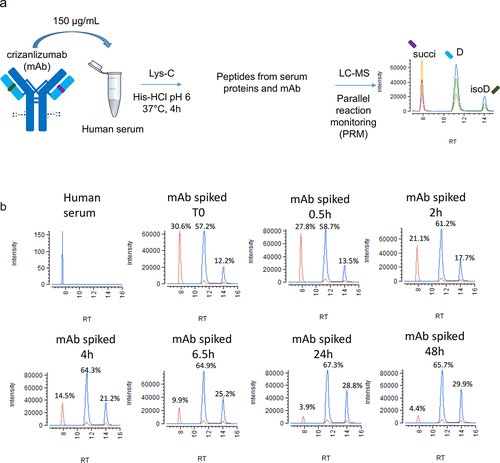
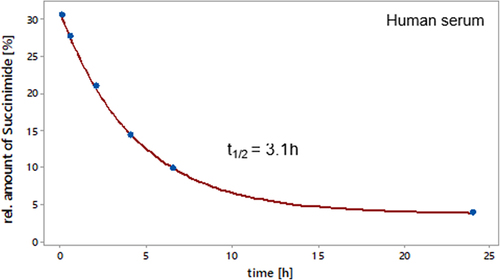
Figure 8. Relative amounts of succinimide in the CDR of crizanlizumab over time in human serum at 37°C. Crizanlizumab stressed for 1 month at 25°C, pH 5 was spiked in human serum at a final concentration of 150 µg/mL and incubated for 0.5, 2, 4, 6.5, 24, and 48 h at 37°C. The relative amount of succinimide in the CDR of crizanlizumab was determined by parallel-reaction monitoring (PRM) as shown in Figure 7. The data up to the 24 h time point was fitted using MiniTab® first-order reaction equation to calculate the half-life.