Figures & data
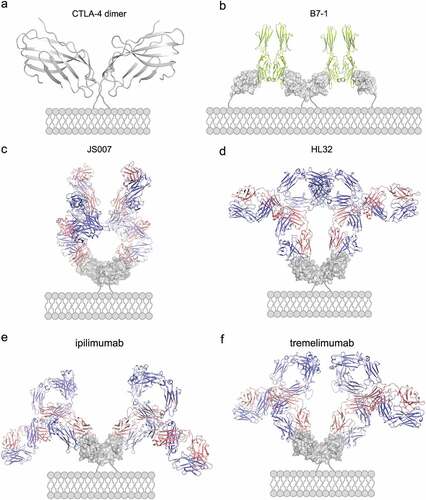
Figure 1. Binding, blocking and T cell activating characteristics of JS007. (a) Flow cytometry-based assay to test the binding between JS007 and CTLA-4, with serially diluted JS007 proteins to stain CHO cells stably expressing CTLA-4. (b) SPR analysis of the binding profiles between JS007 and CTLA-4. (c) Flow cytometry-based blocking assay to analyze the blocking of CD80-mFc protein to CHO cells stably expressing CTLA-4, with serially diluted JS007 proteins added. The binding and blocking of ipilimumab was tested in parallel as control, whereas human IgG1 isotype was analyzed as negative control. (d) Enhanced IL-2 production of T cells stimulated with allogeneic human dendritic cells in the presence of varied concentrations of JS007 as indicated. The concentration of IL-2 was measured with ELISA assay. Stimulation with serial dilutions of ipilimumab or human IgG1 isotype control were also enrolled as controls. Statistical analysis was calculated with student’s T test. ***, p < .001; **, p < .01; *, p < .05; ns, p > .05.
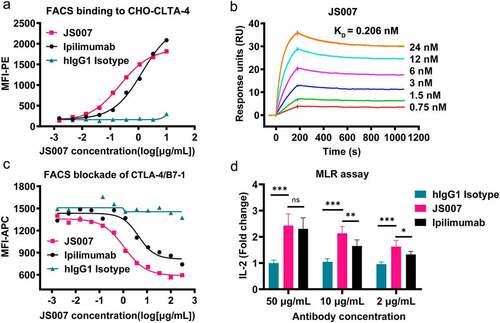
Figure 2. Tumor inhibition potency of JS007 in syngeneic tumor model. (a) The in vivo tumor suppression efficacy of JS007 in hCTLA-4 knock-in mice of the C57BL/6 background by inoculation of MC38 tumor cell line. JS007 was injected i.p. twice a week in low dose groups (0.1 mg/kg) and high dose group (1 mg/kg). 1 mg/kg of ipilimumab or hIgG1 isotype antibodies were injected as control. The data with each dot shows the average tumor volume of the group while the SE was presented as longitudinal bars. (b) The tumor weight of each group at the end of the experiment was shown. (c) The in vivo tumor suppression efficacy of JS007 in hCTLA-4 knock-in mice of the BALB/c background by inoculation of H22 tumor cell line. JS007 was injected i.p. twice a week in two groups, 0.03 mg/kg low dose group and 0.1 mg/kg high dose group. 0.1 mg/kg of ipilimumab or hIgG1 isotype antibodies were injected as control. (d) The tumor weight of each H22 syngeneic tumor group at the end of the experiment was shown. Statistical analysis was calculated with Wilcoxon paired T test. *, p < .05; ns, p > .05.
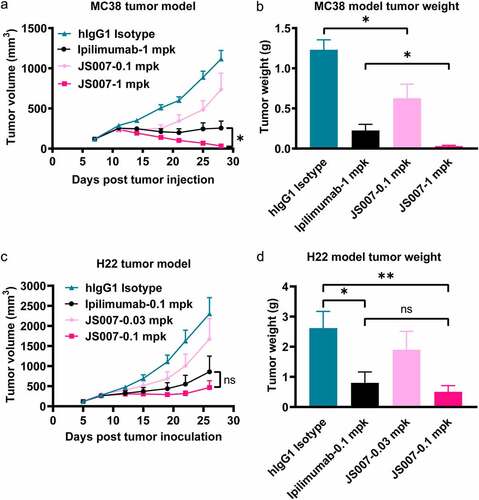
Figure 3. Structural basis for the interaction between JS007-scFv and CTLA-4. (a) Overall structure of the JS007-scFv and dimeric CTLA-4 complex. CTLA-4 is shown as cartoon representations in gray, and the heavy (VH) and light chains (VL) of scFv are shown in cyan and Orange, respectively. The CDR1, CDR2 and CDR3 loops of VH are colored in yellow, red, and light pink, respectively. The CDR1, CDR2 and CDR3 loops of VL are colored in green, blue and purple, respectively. (b-c) Detailed interactions involving the VH domain (b) and VL domain (c) of JS007 within the interface of JS007/CTLA-4 complex. The residues involved in the hydrogen bond interactions are shown as sticks and labeled. Hydrogen bonds are shown as dash lines. (d) Highlights of the two Tyr residues from JS007 inserting into the cavities on the surface of CTLA-4. The CTLA-4 is shown as electrostatic potential surface and the two Tyr residues present as sticks. (e) Detailed interactions involving the two Tyr residues with residues form the BC loop, DE loop and FG loop. Hydrogen bonds are shown as black dash lines, while Van der Waals interactions are shown as yellow dash lines.
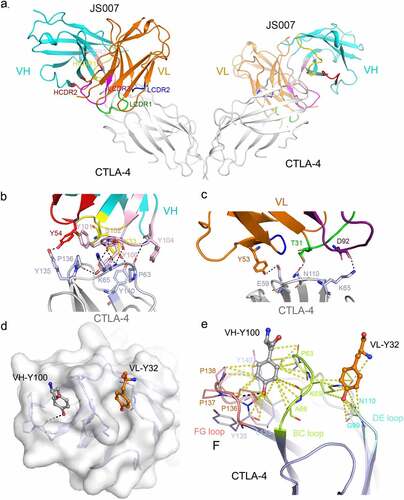
Figure 4. Competitive binding of JS007-scFv and B7-1/B7-2 with CTLA-4. (a) Superposition of the JS007/CTLA-4 complex structure with CTLA-4/B7-1 complex structure (PDB: 1I8L). CTLA-4 is shown as surface diagram in gray, B7-1 in pink, JS007 VH in cyan and VL in Orange, respectively. (b) Binding surface of CTLA-4 by B7-1 or JS007. The binding residues by B7-1 on CTLA-4 are colored in pink, whereas residues contacted by the JS007 VH or VL domain are colored in cyan or Orange, respectively. The residues contact with both VH and VL are colored in green, and the overlapping residues bound by both B7-1 and JS007 are colored in light pink. (c) Superposition of the JS007 /CTLA-4 complex structure with CTLA-4/B7-2 complex structure (PDB: 1I85). B7-H2 is shown as cartoon in brown and the other parts are the same as in (a). (d) Binding surface of CTLA-4 by B7-2 or JS007. The binding residues by B7-2 on CTLA-4 are colored in brown, whereas residues contacted by the JS007-scFv VH or VL are colored the same as in (b). The residues contact with both VH and VL are colored in green, and the overlapping residues bound by both B7-2 and JS007 are colored in light blue.
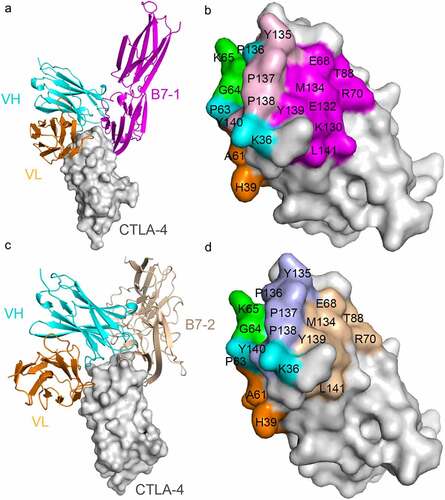
Figure 5. Comparative analysis of the binding areas of JS007, ipilimumab, tremelimumab and HL32. (a-b) The front and back of CTLA-4 is shown in cartoon. (c-h) The binding surface of B7-1, B7-2, JS007, ipilimumab, tremelimumab and HL32 on CTLA-4 were depicted and colored as indicated. The binding surface areas for the ligand or the corresponding mAbs are labeled below each surface map. (i) Sequence alignment of the CDR loops of the four mAbs.
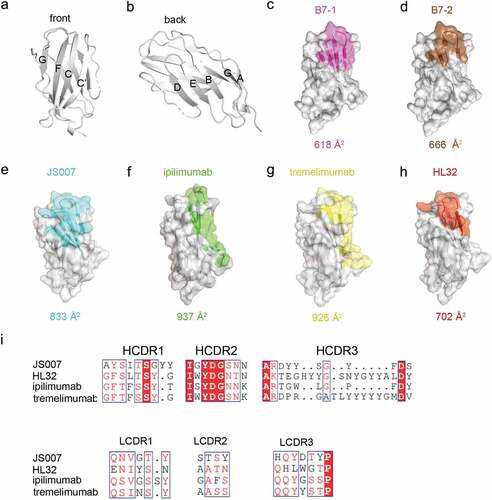
Figure 6. Structural modeling of the binding of full-length antibody to dimeric CTLA-4 on cell surface. (a-b) Structure of dimeric CTLA-4 (a) and the binding of B7-1 to dimeric CTLA-4 (b). The B7-1 is depicted in lemon while CTLA-4 in gray. (c-f) Structure of full-length JS007 (c), HL32 (d), ipilimumab (e) and tremelimumab (f) antibodies to dimeric CTLA-4. The heavy chain of antibody is presented as cartoon in blue, while the light chain is colored in salmon. The dimeric CTLA-4 is presented as surface and colored in gray.