
Figures & data
Figure 1. The TrYbe® and potential applications. An illustrative representation of the TrYbe® format with three target binding regions (Fab region 1, ds-scFv region 2 and ds-scFv region 3). The TrYbe® is composed of a Fab fragment scaffold at its core and two ds-scFvs connected to the C-termini of the respective Fab light and heavy chain via S(G4S)2 linkers. DSBs are represented as – . Potential mechanisms of action of the TrYbe® are outlined. Abbreviations: neonatal Fc receptor, FcRn; Transferrin receptor, TfR; blood brain barrier, BBB. Figure 1 shows an inner circle in the center of the figure, containing a cartoon of the TrYbe® with the constant regions and antigen-binding regions indicated. Seven, equidistant arrows extend outwards from the circle and point to cartoons indicating a different mechanism of action of the TrYbe®: 1) immune modulation is represented by TrYbes® shown to co-engage with two different receptors on a cell and initiate a signal into the cell to indicate receptor activation or receptor inhibition. In another scenario a TrYbe® is shown to co-engage with receptors which indices a novel function via signaling or bind to two paratopes on the same receptor to elicit a biparatopic response. Jagged arrows are used to denote a signal inside the cell from each engaged TrYbe®-receptor complex; 2) co-receptor clustering is represented by a TrYbe® binding to two distally separated receptors on a cell. An arrow points to another TrYbe® which is now engaging two clustered receptors. A jagged arrow denotes a signal elicited inside the cell from the engaged TrYbe®-receptor complex; 3) Ligand- receptor co-localization is represented by a TrYbe® binding to a soluble ligand and a surface receptor on a cell. A jagged arrow denotes a signal inside the cell, elicited from the engaged TrYbe®-receptor complex; 4) Recruitment of immune cells shows a TrYbe® engaging a surface receptor on a target cell by one ds-scFv and another receptor on an effector cell by the other ds-scFv. A jagged arrow denotes a signal inside the cell, elicited from the engaged effector cell; 5) Piggybacking (FcRn recycling) is represented by a cell containing an endosome which is signified by a circle with receptors on the inner side. A TrYbe® is shown to engage to a FcRn recyclable ligand and subsequently is endocytosed into the cell. An arrow then shows the same TrYbe® in the endosome where the FcRn recyclable ligand also engages a endosomal receptor on the inner side whilst still bound to the TrYbe®. An arrow then shows the TrYbe® being exocytosed from the cell on the apical side whilst still being bound to the ligand; 6) Similar to 5), a TrYbe® is shown to engage a TfR receptor on the cell surface on the apical side. An arrow points to the TrYbe® now in an endosome, followed by another arrow point showing the TrYbe® transcytosed from the cell on the basolateral side; and 7) dual blockade is represented as a TrYbe® blocking the binding of soluble ligands to a cell and in another scenario, a TrYbe® blocking ligands binding to two receptors.
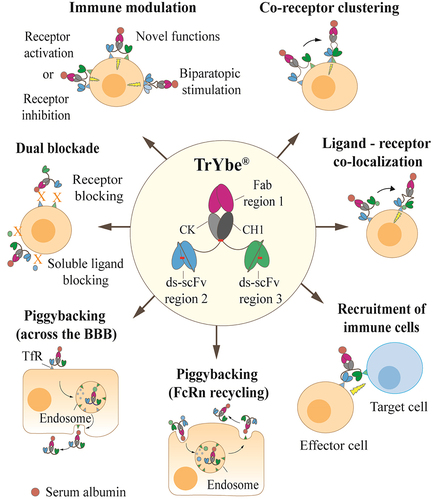
Figure 2. Atomic model and SAXS parameters of the TrYbe®. A) Ribbon representation of a TrYbe® homology model based on TrYbe® A showing the IL-17A binding Fab variable (purple) and constant (gray) regions, with the anti-TNF ds-scFv (blue) and anti-albumin ds-scFv (green) attached to the respective Fab light (pale) and heavy (dark) chain. Structural parameters Rg, porod volume (Vp) and Dmax obtained from SAXS analysis are displayed (see Table S2). B) A surface representation of the TrYbe® format highlighting orientation of the CDRs (solid purple) and modeled S(G4S)2 linkers (gray spheres). Figure 2 shows two models of the TrYbe® as deduced by SAXS analysis. Part A is a three-dimensional model showing the beta sheet orientations of the TrYbe®’s Fab, constant and ds-scFv domains within a dotted circle. The SAXS parameters (Rg, Vp, and Dmax) are indicated on this figure. These are mathematical measurements where Rg indicates the degree of compactness of a TrYbe®, Vp is the volume occupied by a TrYbe® and Dmax is the largest interparticle distance reached by a TrYbe®. Rg is represented by a dotted arrow starting in the midpoint of the TrYbe® and extends to the left toward the dotted circle. The value of Rg is indicated as 41.2 Å; Vp is represented by a dotted line connected to the dotted circle at 180° angle and extends inwards toward the TrYbe®. The value of Vp is given as 157,140 Å; Dmax is represented by a double arrowed dotted line that cuts across the diameter of the dotted circle from top to bottom at a 45° angle. The value of Dmax is given as 130 Å. Part B of the figure shows a model of the 3-D surface of the TrYbe® model where CDRs of each domain are highlighted.
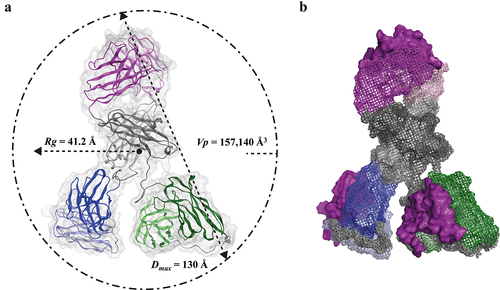
Figure 3. Disulfide stabilization and improved TrYbe® stability upon storage. TrYbes® B (![]()
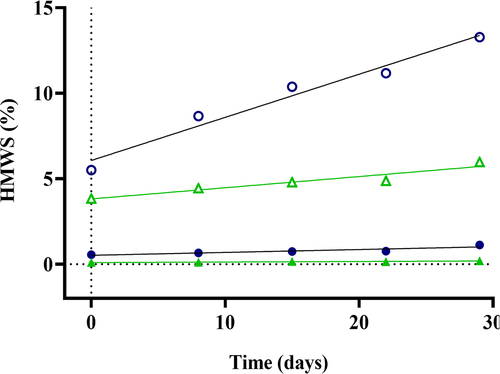
Table 1. TrYbe® A binding kinetics and simultaneous binding responses to TNF, IL-17A and HSA.
Figure 4. Human rheumatoid arthritis synoviocytes seeded in the lower chamber of a 24-well trans well plate was stimulated with Th17 supernatants for 24 h and in the presence of isotype IgG as a negative control (![]()
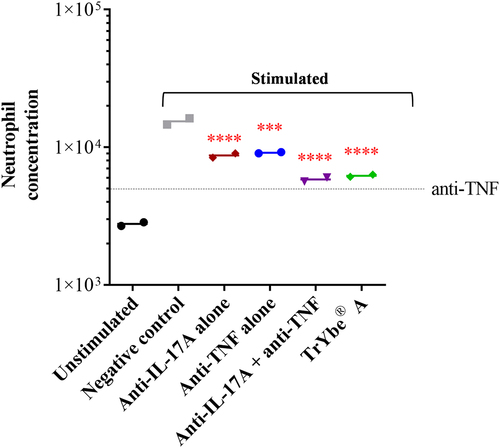
Figure 5. Inhibition of the p38 B cell signaling pathway by CD79b/CD22 -specific formats. In IgM-stimulated B cells, phosphorylation of the p38 B cell signaling pathway was inhibited by TrYbe® D (![]()
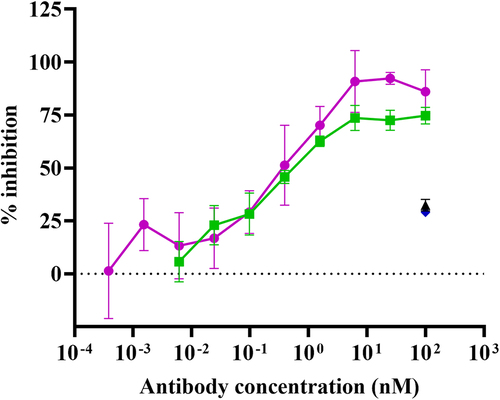
Figure 6a. Bispecific antibody formats targeting TNF-α and IL-17A The antibody formats are (a) TrYbe® A, (b) DVD-IgG, ABT-122 and (c) a FynomAb, COVA322. Binding specificities are annotated as: anti-IL-17A (blue), anti-TNF (magenta), anti-HSA (green).
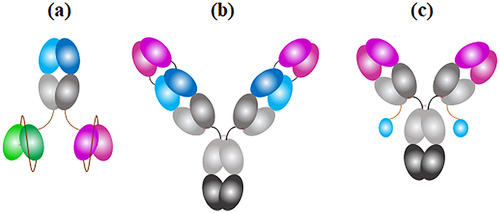
Figure 6b. Antibody:antigen complex formation with antigens added independently or in combination DLS was used to measure complex volume (nm3) formed when molar ratios of the TrYbe®, DVD-IgG and FynomAb were combined with (a, i) TNF, (b, i) IL-17A or (c, i) both TNF and IL-17A. Plots designed as (ii) represent zoomed-in versions of the respective plots a-c to focus on the smaller complex volumes of TrYbe® and FynomAb, where applicable. The antibody formats are indicated as follows: TrYbe® A (![]()
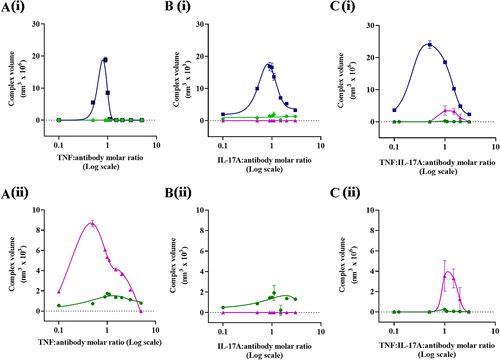
Figure 6c. UV-vis spectroscopic analysis of antibody:antigen complexes A molar 1:1 ratio of the TrYbe® (TrYbe® A), DVD-IgG (ABT-122) or the FynomAb (COVA322) complexed with TNF (![]()
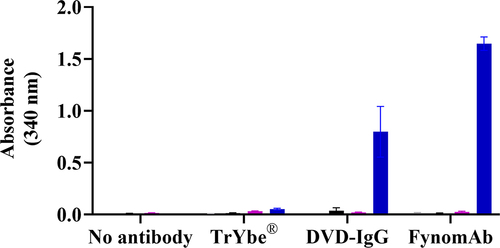
Table 2. Pharmacokinetic parameters of TrYbe® E and F in cynomolgus monkeys.
Figure 7. PK of TrYbes® in cynomolgus monkey. Two treatment groups (n = 3) were dosed with a TrYbe® at 10 mg/kg either intravenously (i.v.) or subcutaneously (s.c.) and are represented as follows: TrYbe® E, i.v. (![]()
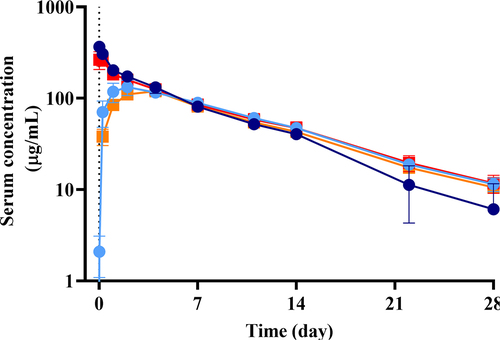
Figure 8. Downstream processing of TrYbes®. The product recovery (%) of TrYbes® E and F following each DSP step is shown. This follows a typical 3-column step process with: protein-A affinity capture, followed by proprietary intermediate and polishing steps. Percentage product recovered (![]()
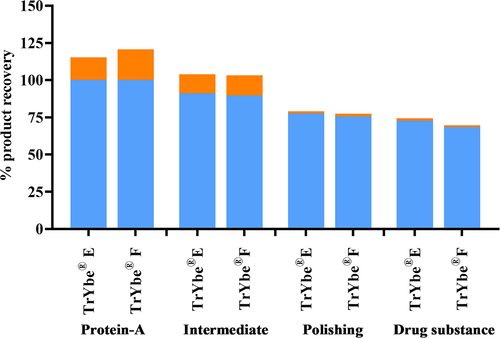
Table 3. Stability of highly concentrated TrYbes®.