
Figures & data
Figure 1. Biochemical characterization and binding properties of Fc-comprising 1 + 1 eIg and 2 + 1 Fab-eIg variants with N-terminal fusions of Fab or eFab. (a) Schematic illustration of 1 + 1 eIg (e11-1-1) and 2 + 1 Fab-eIg variants (e21-1-1, e21-1-2, e21-1-3). Nomenclature: e: bispecific antibody containing an eFab; first two numbers referring to valency: 11 - monovalent binding to EGFR (blue) and CD3 (red)/21 - bivalent binding to EGFR (blue) and monovalent binding to CD3 (red)/third number referring to presence of Fc-part: 1 - with Fc-part; fourth number referring to geometry: continuous number. The constant domains of the heavy chain are shown in gray, the constant domain of the light chain in white and the hetEHD2 domain in orange. (b) Size-exclusion chromatography by HPLC after preparative size-exclusion chromatography by FPLC. (c) SDS-PAGE analysis under reducing (red.) and non-reducing (n.r.) conditions. (d) EGFR-binding ELISA using 3 µg/mL EGFR-ECD-moFc as antigen and an HRP-conjugated antibody specific for human Fc (Mean ± S.D; n = 3). (e) Cell binding to CD3-expressing Jurkat cells analyzed by flow cytometry using a RPE-conjugated antibody specific for human Fc (Mean ± S.D; n = 3; MFI: median fluorescence intensity).
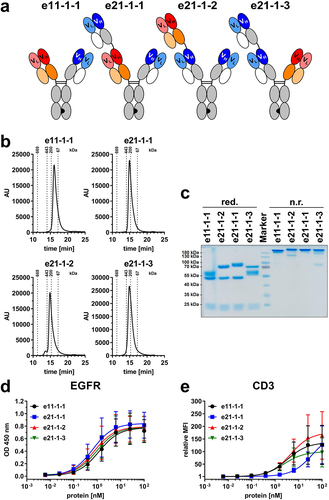
Table 1. Productivity and integrity of 1 + 1 eIg and 2 + 1 Fab-eIg variants with N-terminal fusions of Fab or eFab (after preparative SEC).
Figure 2. Cell binding to cancer cell lines, cytotoxicity and T-cell activation of Fc-comprising 1 + 1 eIg and 2 + 1 Fab-eIg variants with N-terminal fusions of Fab or eFab. (a – d) Binding to (a) FaDu, (b) LIM1215, (c) MCF-7 and (d) SW620 analyzed by flow cytometry using a R-PE-conjugated antibody specific for human Fc (Mean ± S.D; n = 3; MFI: median fluorescence intensity). (e – h) Cytotoxic potential of PBMCs co-cultured with the cancer cell lines (e) FaDu, (f) LIM1215, (g) MCF-7 and (h) SW620 in an effector-to-target ratio of 5:1 (Mean ± S.D.; n = 3 - three individual donors). (i + j) Release of (i) IL-2 after 24 h and (j) IFNγ after 48 h by PBMCs co-cultured with FaDu using an effector-to-target ratio of 5:1 analyzed by sandwich ELISA (Mean ± S.D.; n = 3 - three individual donors). (k + l) Proliferation of (k) CD4+ and (l) CD8+ T-cells determined by CFSE dilution in flow cytometry from co-culture assays with FaDu using an effector-to-target ratio of 5:1 (Mean ± S.D.; n = 3 - three individual donors).
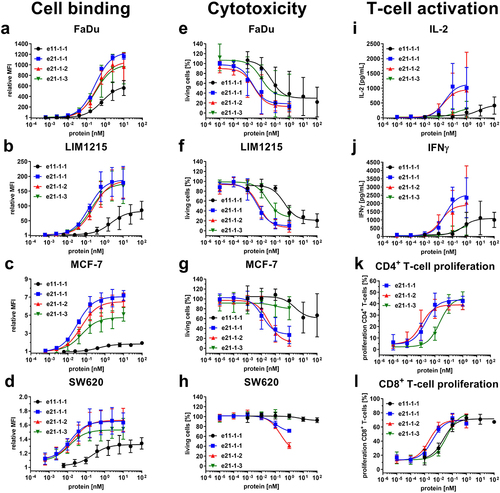
Table 2. Bioactivity of 1 + 1 eIg and 2 + 1 Fab-eIg variants with N-terminal fusions of Fab or eFab (n.D. – not determinable).
Figure 3. Biochemical characterization and binding properties of Fc-comprising 2 + 1 eIg-Fab variants with C-terminal fusions of Fab or eFab. (a) Schematic illustration of 2 + 1 eIg-Fab variants (e21-1-4, e21-1–5, e21-1-6). Nomenclature: e: bispecific antibody containing an eFab; first two numbers referring to valency: 21 - bivalent binding to EGFR (blue) and monovalent binding to CD3 (red)/third number referring to presence of Fc-part: 1 - with Fc-part; fourth number referring to geometry: continuous number. (b) Size-exclusion chromatography by HPLC. (c) SDS-PAGE analysis under non-reducing (n.r.) and reducing (red.) conditions. (d) EGFR-binding ELISA using 3 µg/mL EGFR-ECD-moFc as antigen and an HRP-conjugated antibody specific for human Fc (Mean ± S.D; n = 3). (e) Cell binding to CD3-expressing Jurkat cells analyzed by flow cytometry using a R-PE-conjugated antibody specific for human Fc (Mean ± S.D; n = 3; MFI: median fluorescence intensity).
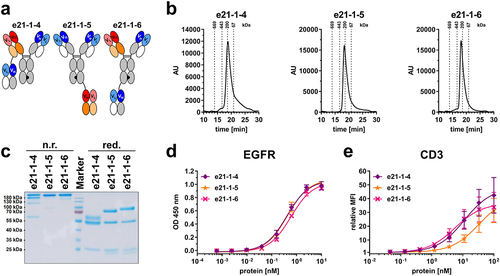
Table 3. Productivity and integrity of 2 + 1 eIg-Fab variants with C-terminal fusions of Fab or eFab.
Figure 4. Cell binding to cancer cell lines, cytotoxicity and T-cell activation of Fc-comprising 2 + 1 eIg-Fab variants with C-terminal fusions of Fab or eFab. (a – d) Binding to (a) FaDu, (b) LIM1215, (c) MCF-7 and (d) SW620 analyzed by flow cytometry using a R-PE-conjugated antibody specific for human Fc (Mean ± S.D; n = 3; MFI: median fluorescence intensity). (e – h) Cytotoxic potential of PBMCs co-cultured with the cancer cell lines (e) FaDu, (f) LIM1215, (g) MCF-7 and (h) SW620 in an effector-to-target ratio of 5:1 (Mean ± S.D.; n = 3 - three individual donors). (i + j) Release of (i) IL-2 after 24 h and (j) IFNγ after 48 h by PBMCs co-cultured with FaDu using an effector-to-target ratio of 5:1 analyzed by sandwich ELISA (Mean ± S.D.; n = 3 - three individual donors). (k + l) Proliferation of (k) CD4+ and (l) CD8+ T-cells determined by CFSE dilution in flow cytometry from co-culture assays with FaDu using an effector-to-target ratio of 5:1 (Mean ± S.D.; n = 3 - three individual donors).
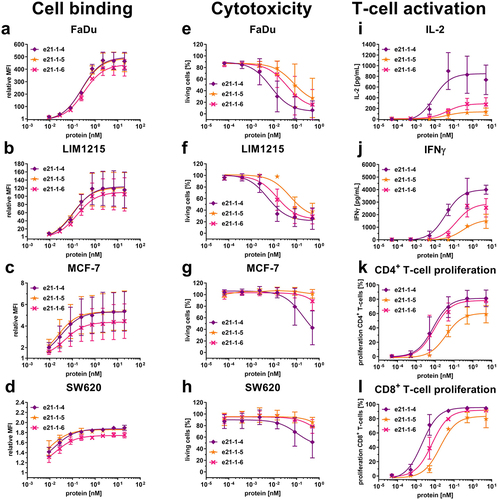
Table 4. Bioactivity of 2 + 1 eIg-Fab variants with C-terminal fusions of Fab or eFab (n.d. – not determinable).
Figure 5. Biochemical characterization and binding properties of Fc-less 1 + 1 and 2 + 1 Fab-eFab variants. (a) Schematic illustration of 1 + 1 (e11-0-1) and 2 + 1 (e21-0-1, e21-0-2, e21-0-3) Fab-eFab variants. Nomenclature: e: bispecific antibody containing an eFab; first two numbers referring to valency: 11 - monovalent binding to EGFR (blue) and CD3 (red)/21 - bivalent binding to EGFR (blue) and monovalent binding to CD3 (red)/third number referring to presence of Fc-part: 0 - without Fc-part; fourth number referring to geometry: continuous number. (b) Size-exclusion chromatography by HPLC after preparative size-exclusion chromatography by FPLC. (c) SDS-PAGE analysis under non-reducing (n.r.) and reducing (red.) conditions. (d) EGFR-binding ELISA using 3 µg/mL EGFR-ECD-moFc as antigen and an HRP-conjugated antibody specific for human Fab (Mean ± S.D; n = 3). (e) Cell binding to CD3-expressing Jurkat cells analyzed by flow cytometry using an FITC-conjugated antibody specific for human Fab (Mean ± S.D; n = 3; MFI: median fluorescence intensity).
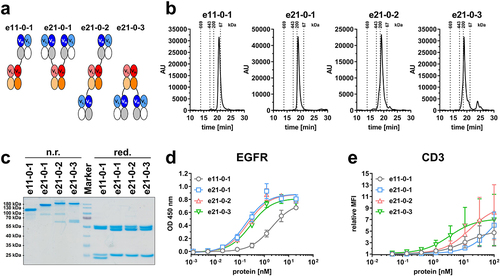
Table 5. Productivity and integrity of Fc-less 1 + 1 and 2 + 1 Fab-eFab variants (after preparative SEC).
Figure 6. Cell binding to cancer cell lines, cytotoxicity and T-cell activation of Fc-less 1 + 1 and 2 + 1 Fab-eFab variants. (a – d) Binding to (a) FaDu, (b) LIM1215, (c) MCF-7 and (d) SW620 analyzed by flow cytometry using a FITC-conjugated antibody specific for human Fab (Mean ± S.D; n = 3; MFI: median fluorescence intensity). (e – h) Cytotoxic potential of PBMCs co-cultured with the cancer cell lines (e) FaDu, (f) LIM1215, (g) MCF-7 and (h) SW620 in an effector-to-target ratio of 5:1 (Mean ± S.D.; n = 3 - three individual donors). (i + j) Release of (i) IL-2 after 24 h and (j) IFNγ after 48 h by PBMCs co-cultured with FaDu using an effector-to-target ratio of 5:1 analyzed by sandwich ELISA (Mean ± S.D.; n = 3 - three individual donors). (k + l) Proliferation of (k) CD4+ and (l) CD8+ T-cells determined by CFSE dilution in flow cytometry from co-culture assays with FaDu using an effector-to-target ratio of 5:1 (Mean ± S.D.; n = 3 - three individual donors).
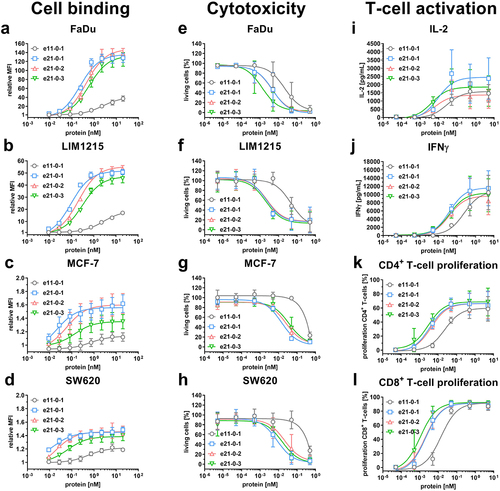
Table 6. Bioactivity of Fc-less 1 + 1 and 2 + 1 Fab-eFab variants (n.D. – not determinable).
Figure 7. Cell binding to cancer cell lines, cytotoxicity and IL-2 release for selected set of formats based on the eIg technology. (a) Schematic illustration for selected formats including e11-1-1, e21–11, e21-1-5, e11-0-1 and e21-0-1. (b) Release of IL-2 after 24 h by PBMCs co-cultured with DiFi using an effector-to-target ratio of 5:1 analyzed by sandwich ELISA (Mean ± S.D.; n = 3 - three individual donors). (c – e) Binding to (c) DiFi, (d) HCT-116 and (e) SW620 analyzed by flow cytometry using a FITC-conjugated antibody specific for human Fab (Mean ± S.D; n = 3; MFI: median fluorescence intensity). (f – h) Cytotoxic potential of PBMCs co-cultured with (f) DiFi, (g) HCT-116 and (h) SW620 in an effector-to-target ratio of 5:1 (Mean ± S.D.; n = 3 - three individual donors).
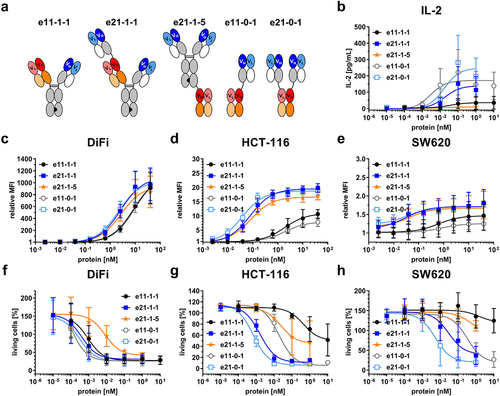
Table 7. Bioactivity of side-by-side comparison for selected formats (n.D. – not determinable).