
Figures & data
Figure 1. Polyreactivity and affinity are generally correlated for anti-CD3 antibodies. The correlation between (a) polyreactivity and (b) AC-SINS values of anti-CD3 antibodies and monovalent affinity to human CD3εδ. Novel CD3 lineage members are shown as filled black circles. Clinical CD3 antibodies (open symbols) are also plotted, where human-specific CD3 antibodies are shown as green squares and cyno cross-reactive lineages are shown as diamonds, with SP34-derived sequences colored purple and non-SP34-derived colored blue. The correlation between (c) polyreactivity and (d) AC-SINS values of anti-CD3 antibodies and monovalent affinity to cyno CD3εδ, colored and represented as above. A comparison of the (e) polyreactivity and (f) AC-SINS values of clinical CD3 antibodies (not including our CD3 lineage) grouped by cyno CD3 cross-reactivity. A comparison (g) of the polyreactivity of 137 clinical antibodies grouped by theoretical Fv pI < 9.3 (left) and ≥ 9.3 (right). A comparison (h) of the theoretical Fv pI of clinical CD3 antibodies (grouped by cyno CD3 cross-reactivity) and our CD3 lineage. Theoretical Fv pI was calculated using combined variable heavy (VH) and light (VL) sequences. Dashed lines intersecting the Y-axis are included where appropriate for ease of reference for PSR (0.1, 0.33, and 0.66; where low PSR is ≥0.10 and <0.33, medium PSR is ≥0.33 and <0.66, and high PSR is ≥0.66 and ≤1.00), AC-SINS (5 and 20; low is ≥5.0 nm and <20.0 nm and high is ≥20.0 nm) and pI (9.3; where high is ≥9.3). Trendline R2 values were determined by semi-log linear regression analysis in GraphPad Prism. Statistical analysis was performed with GraphPad Prism using the unpaired t-test, assuming a Gaussian distribution and the same SD for both populations (*p ≤ 0.05, **p ≤ 0.01 and ***p ≤ 0.001).
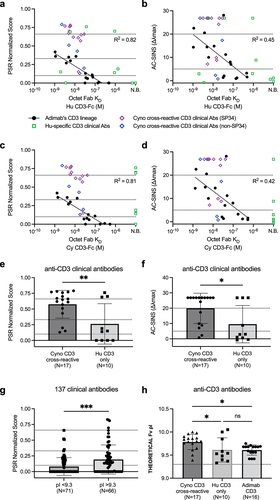
Figure 2. The CD3ε peptide is cradled in a concave paratope on the ADI-26906 Fv. Crystal structure of the CD3ε N-terminal peptide bound to ADI-26906 Fab (shown as Fv). (a, b) The CD3ε peptide is shown as a ball-and-stick model, with carbon atoms colored light gray, oxygen atoms red, nitrogen atoms blue and sulfur atoms yellow. The peptide 2Fo-Fc electron density at 3.0 sigma is shown as a blue mesh with a 1.8 Å carve. (a) 2Fo-Fc density was calculated from an SA omit map generated in PHENIX after simulated-annealing refinement with the inhibitor occupancy set to 0.0 and with zero occupancy atoms ignored during refinement. 120° clockwise rotation around the Y-axis of the CD3 peptide is shown with black dashed lines showing the hydrogen bonds that form the canonical 310 helix (b) ADI-26906 Fv is shown as a molecular surface with heavy chain colored tan and light chain colored green, where the binding footprint of the peptide is shown in darker shades. (c) The top and side view of the CD3ε peptide proximite to isolated CDR loops of ADI-26906 which are shown as ribbons. Chains and the CD3 peptide are colored the same as in 2a and 2b (d) The electrostatic surface potential (calculated at pH 7.0 using ABPS) of the CD3ε peptide (left) and the paratope of ADI-26906 Fab (right), are shown as a color scale from red (predicted electronegative surface patches) to blue (predicted electropositive surface patches). Top view (e) of N-terminal pyroglutamic acid of the CD3ε peptide bound to the ADI-26906 paratope. Side chains are shown as transparent molecular surfaces. Key interactions are represented as dotted lines, with hydrophobic interactions in blue, aromatic pi-stacking interactions in pink, hydrogen bonding in gray, and salt bridges in lime green. Top view (f) of Glu6 of the CD3ε peptide bound to the ADI-26906 paratope. Colored the same as 1e. The center-of-charge of the carboxylic acid of glutamate is represented by a spherical pseudoatom colored lime green. Views (g) of Asp2 (leftmost), Gly3 (middle left), Asn4 (middle right), and Met7 (rightmost) residues on the CD3ε peptide and their interactions with key residues in the ADI-26906 paratope, colored and represented the same as in 1f. Residues in the antibody variable regions are referred to using the Chothia numbering system.
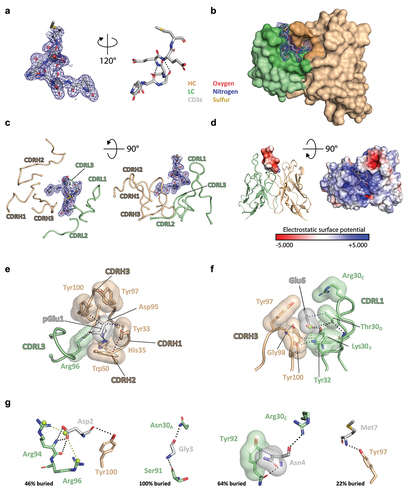
Figure 3. Analysis of single amino acid substituted variants supports insights from the ADI-26906:CD3ε peptide co-complex structure. ADI-26906 IgG binding to cells (left Y-axes) or CD3εδ as assessed by BLI (right Y-axes) when key side chains (highlighted red in sequences) that were identified to interact with either (a) pGlu1, (b) Glu6, (c) Asp2, Gly3, Asn4, or Met7 through crystallographic analysis were substituted. Cell binding MFI is shown in red circles, with the dark red as human Jurkat and light red as cyno HCS-F cells. BLI responses are shown in blue squares, with dark blue as human CD3εδ binding and light blue as cyno CD3εδ binding. ADI-26140, (far right of each graph) the IgG1 isotype control, is included for comparison.
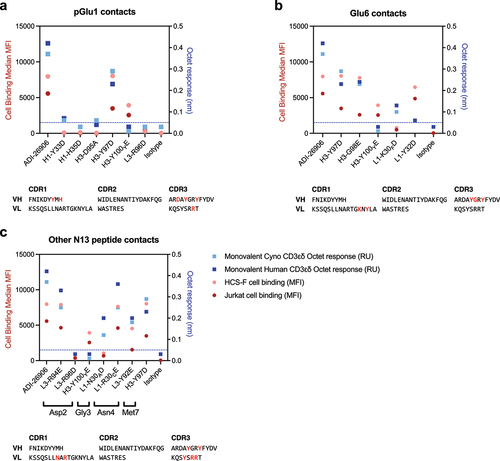
Figure 4. Acidic amino acid substitutions from top outputs decreased polyreactivity when transferred into the sequence of a high affinity lineage member. Human CD3ɛδ affinity versus the (a) polyreactivity and (b) AC-SINS value of the initial 13 best outputs from our ADI-26906 engineering efforts, in relation to their monovalent affinity to human CD3εδ, shown as filled black or green circles, with ADI-26906 shown as a red circle. Highlighted in green are the clones from which we transferred the acidic amino acid substitutions into ADI-50024, our high affinity CD3-binding variant. Human CD3ɛδ affinity versus the (c) polyreactivity and (d) AC-SINS value of ADI-26906 and ADI-50024 offspring substituted with the reduced polyreactivity substitutions from the six clones, shown in black or purple. ADI-50024 offspring are shown as squares, with parents shown in red. Highlighted in purple are the clones we chose to validate in a bispecific format. Dashed lines intersecting the Y-axis (panels a – d) are included where appropriate for ease of reference for PSR (y = 0.1 and 0.33; where low PSR is ≥0.10 and <0.33 and medium PSR is ≥0.33 and <0.66) and AC-SINS (y = 5 and 20; low is ≥5.0 nm and <20.0 nm and high is ≥20.0 nm).

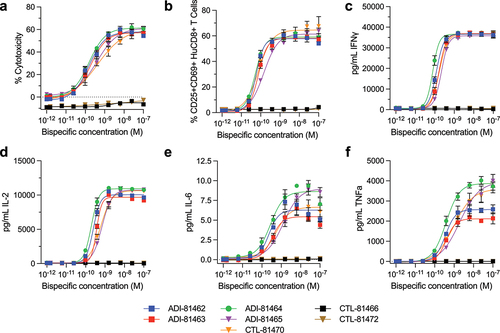
Figure 5. CD20xCD3 bispecific antibodies mediate RTCC in-vitro. Preactivated human CD8+ lymphocytes were incubated with serial dilutions of CD20 × CD3 or control bispecific antibodies and CD20-positive Raji cells at an effector:target ratio of 10:1 for 24 h. Flow cytometric analysis was performed to simultaneously evaluate the number of surviving Raji cells (a) as a measure of cytotoxicity and CD8+ T cell activation and (b) by assessing co-expression of CD69 and CD25 activation markers. Cytokine analysis of culture supernatants was performed by multiplexed MSD assays to assess levels of bispecific antibody mediated secretion of IFNγ (c), IL-2 (d), IL-6 (e) and TNFa (f). Data are representative of one experiment with three replicates using lymphocytes from a single human donor.
Supplemental Material
Download MS Word (2.7 MB)Data availability statement
Coordinates and structure factors for ADI-26906-Fab complexed to the CD3ε-N13 peptide @ pH 6.5 have been deposited in the Protein Data Bank under accession code 8F0L. https://doi.org/10.2210/pdb8F0L/pdb. All other data are available in the manuscript or supplementary materials.