Figures & data
Table 1. Summary of examples for applications of mechanistic PK/PD models.
Figure 1. Schematic of how mechanistic PK/PD models can support drug discovery and development across the pipeline. Different data can be leveraged at each stage (text above the model diagram) to build a mechanistic PK/PD model that can be used to answer questions specific to the stage of development (text below the model diagram). Established early, then updated continuously, the model can seamlessly support decisions from early discovery to clinical. Figure created with BioRender.Com.
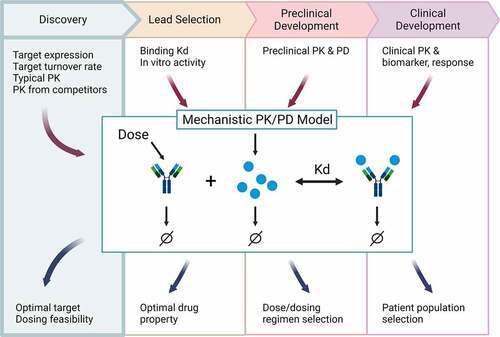
Figure 2. Mechanistic PK/PD model analysis of magrolimab. A) model diagram of the monospecific anti-receptor with membrane ligand competitor (4-compartment) model from Applied BioMath Assess™ used for simulating PK, target engagement and target inhibition of magrolimab. B) Simulations of 7 doses of magrolimab, dosed at 3 to 50 mg/kg IV Q1W. Left panel is simulated drug concentration vs. time in central compartment, middle panel is target engagement vs. time in tumor (disease compartment), and right panel is target inhibition vs. time in tumor. C) from the simulations in B), the dose vs. trough target engagement and trough target inhibition in the tumor is plotted. Doses predicted to achieve 95% target engagement or inhibition are indicated.
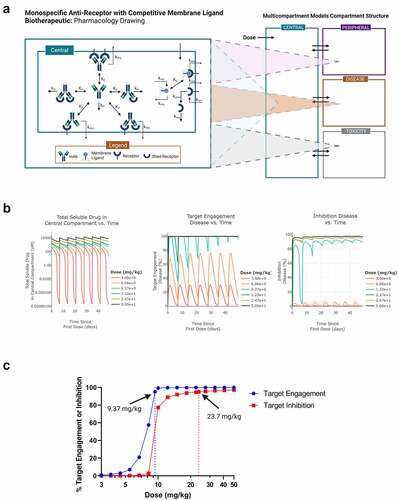
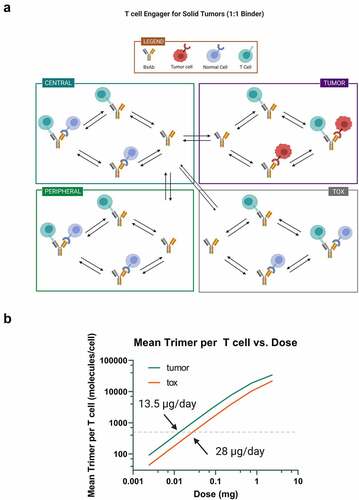
Figure 3. Mechanistic PK/PD model analysis of solitomab. A) model diagram of the T cell engager for solid tumors model in Applied BioMath Assess™ used for simulating solitomab PK and trimer formation in the tumor and tox compartments. B) from these simulations, the dose vs. mean trimer in the tumor and tox compartments are plotted. The dose predicted to result in 500 trimers/cell in each compartment is indicated.