Figures & data
Table 1. Clinical progression counts for the 137 mAbs with in vitro experimental data.
Table 2. Summary of in vitro assay clusters determined using hierarchical clustering following Spearman rank correlation analysis.
Figure 1. Spearman rank correlation analysis for the set of in vitro assays with measurements for 100 or more mAbs. A. Hierarchical clustering with average linkage used to merge clusters. B. Matrix of calculated correlations between the in vitro measurements. The red boxes and black rectangles outline the individual assay clusters. The eccentricity of the ellipses is proportional to the magnitude of the correlation coefficient. The slope of the major axis has the same sign as the correlation coefficient. The numeric suffixes in the names map to literature sources for the data (‘Definitions’ in the supplementary information).
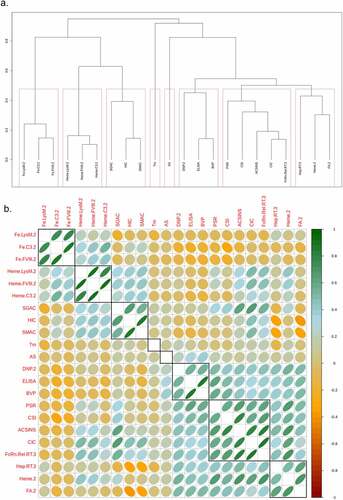
Table 3. Determination of 90% thresholds for the approved mAbs within the set of 137 mAbs with experimental data.
Table 4. Summary of in silico descriptor groups determined using hierarchical clustering following Spearman rank correlation analysis.
Figure 2. Proportion of mAbs with in vitro cluster violations as a function of clinical progress. The order of the clusters follows from top left to bottom right in Figure 1. The number of individual assay violations determining the cluster violation is indicated in the text above each panel.
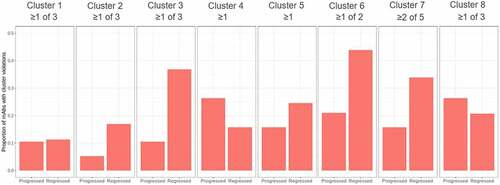
Figure 3. Distribution of in vitro measurements as a function of clinical progress. The values for the 2017 Approved set (48 mAbs) are shown for reference. The blue and red crossbars indicate the median and 90% values for each distribution. The red crossbars for the Approved set are the thresholds used to assign assay violations.
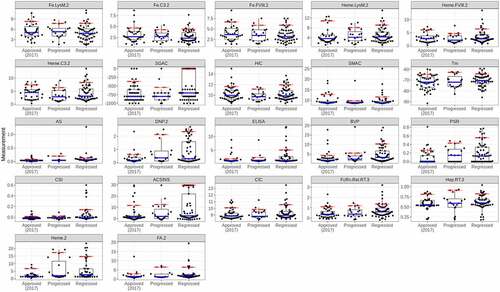
Figure 4. Spearman rank correlation analysis for the set of in silico descriptors with values for 60 or more mAbs. A. Hierarchical clustering with average linkage used to merge clusters. B. Matrix of calculated correlations between the in silico measurements. The red boxes and black rectangles outline the individual descriptor clusters. The numeric suffixes in the names map to literature sources for the data (‘Definitions’ in the supplementary information)..
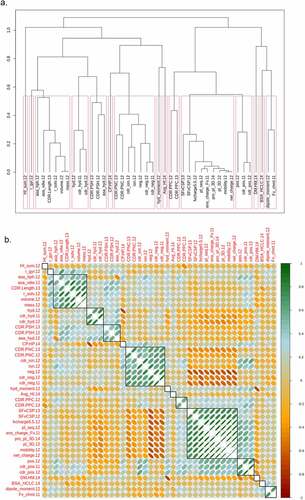
Table 5. Summary of counts and proportions for mAbs without violations in Approved, Clinical, and Clinical to Approved sets for different studies.
Table 6. Summary of counts and proportions for mAbs without violations in Approved, Clinical, and Clinical to Approved sets for different studies using predictions from Abpred.
Figure 5. AUROC for discriminating mAbs with in vitro measurements exceeding the 90% threshold determined on 48 approved mAbs using in silico descriptors. Clustering for in silico descriptors was repeated for the subset with values for 100 or more mAbs. Columns Fit1 and Fit0 contain values obtained from cross-validation predictions using lasso and ridge regression, respectively. The numeric suffixes in the names map to literature sources for the data (‘Definitions’ in the supplementary information).
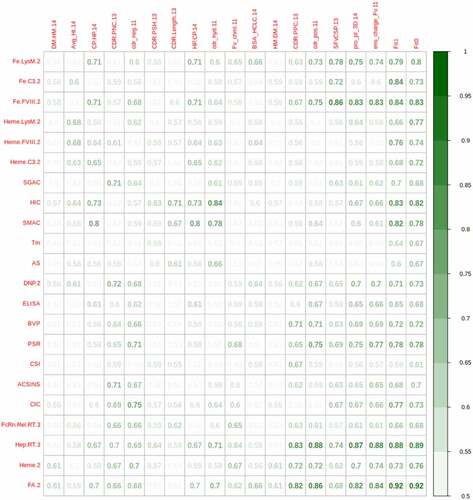
Figure 6. Penalized logistic regression using glmnet for discriminating mAbs with in vitro measurements exceeding the 90% threshold (based on the 48 Approved 2017 mAbs) using in silico descriptors. Average coefficients from 10 repeats of 10-fold cross validation using the lasso regularization penalty are shown. The numeric suffixes in the names map to literature sources for the data (‘Definitions’ in the supplementary information).
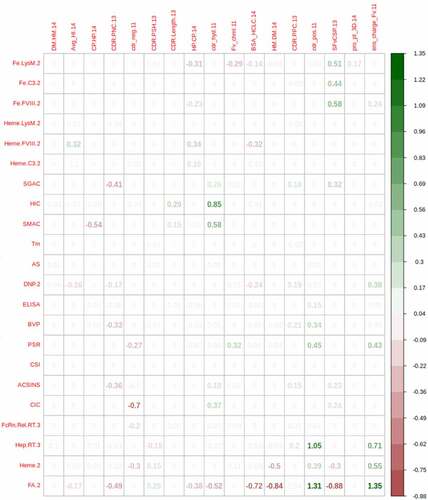
Figure 7. Identification of outliers for experimental PSR scoresCitation20,Citation21 and HIC RTCitation20 from AbpredCitation22 predictions on sequences from B cells. ROC curves and areas are shown for two PSR thresholds, corresponding to the 90% thresholds for the 48 and 64 approved mAbs in 2017 and 2022, respectively. Only one curve is plotted for HIC, since they are identical for the two thresholds.
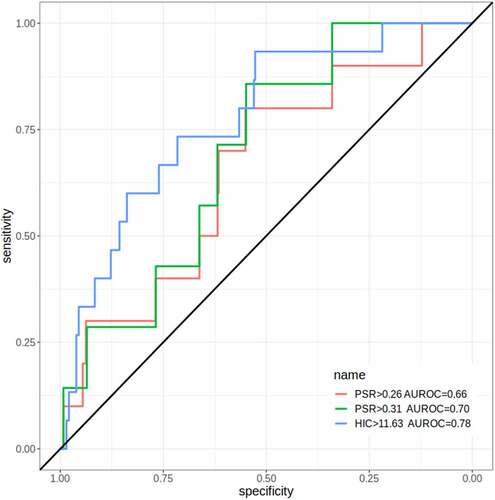
Figure 8. Comparison of four TAP descriptors reported in Grinshpun et al. (calculated from MOE homology models) on the x-axis vs Raybould et al. (calculated from ABodyBuilder homology models) on the y-axis. The numeric suffixes in the names map to literature sources for the data (‘Definitions’ in the supplementary information).
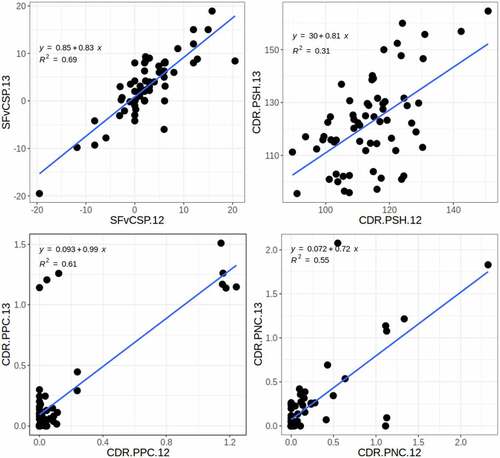
Figure 9. Comparison of CDR hydrophobic, positively charged and negatively charged patch descriptors calculated using MOE 2020.09.01 in Thorsteinson et al. (x-axis) vs. MOE 2019.01 in Grinshpun et al. (y-axis). The numeric suffixes in the names map to literature sources for the data (‘Definitions’ in the supplementary information).
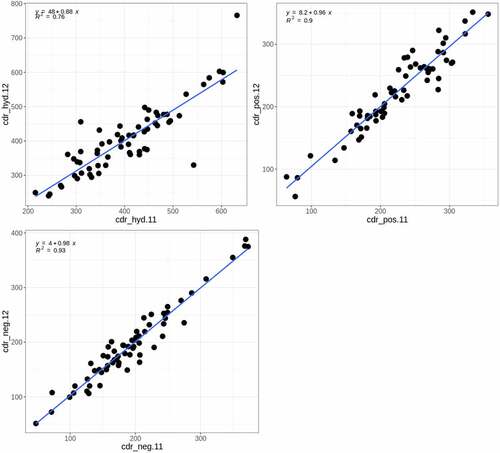
Figure 10. Comparison of in vitro measurements between independent assessments. A. Binding to CHO-derived polyspecificity reagent on yeast-presented mAbsCitation5 vs. mAbs captured on ProA beads.Citation11 B. Aggregation rate in HBS pH 7.3 40 ºC mAbsCitation5 vs. His-HCl pH 6.0 40 ºCCitation15 C. Self-interaction measurements using the ACSINS assay in Jain et al. vs. Avery et al. D. FcRn column retention time in Kraft et al. vs. Avery et al. E. HIC column retention time in Jain et al. vs Fekete et al. The numeric suffixes in the names map to literature sources for the data (‘Definitions’ in the supplementary information).
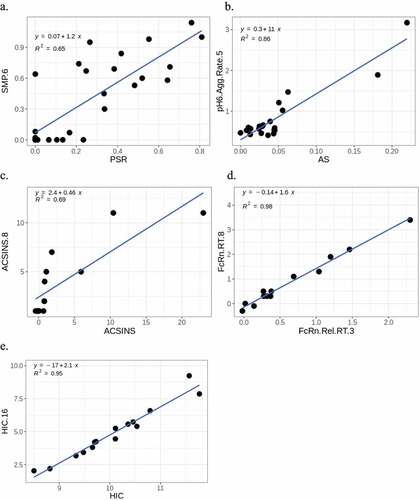
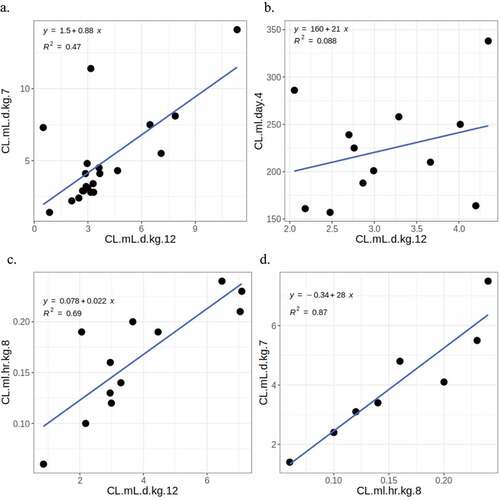
Figure 11. Comparison of human clearance values for mAbs from different studies. A. Grinshpun et al. vs. Chung et al. B. Grinshpun et al. vs. Hu, Datta-mannan, et al. C. Grinshpun et al. vs. Avery et al. D. Avery et al. vs. Chung et al. The numeric suffixes in the names map to literature sources for the data (‘Definitions’ in the supplementary information).