
Figures & data
Figure 1. Avidity-driven binding of ACE2 decoys to SARS-CoV-2 Wuhan (WT) strain spike RBD increases with higher ACE2 valency.
(A) Schematics of IgG OA, IgG, IgA, and IgM ACE2 decoy designs to illustrate the increasing ACE2 valency from 1 to 10. (B) SPR sensorgrams to depict how the off-rate of ACE2 decoys for binding SARS-CoV-2 Wuhan spike RBD decreases with increasing ACE2 valency, accounting for the increase in measured apparent affinity. (C) Graphs with KD, ka, and kd values plotted for ACE2 decoys measured using SPR sensor chips with different levels of immobilized spike protein show that increased immobilized spike RBD results in decreased off-rate and increased apparent affinity for multivalent ACE2 decoys.
(a) Depicted left to right is monovalent IgG OAA ACE2 decoy, bivalent IgG ACE2 decoy, tetravalent IgA ACE2 decoy, and decavalent IgM ACE2 decoy with the Fc scaffold colored blue and ACE2 shown in green. (b) SARS-CoV-2 Wuhan (WT) spike protein RBD binding sensorgrams for (left to right) IgG OAA, IgG, IgA, and IgM ACE2 decoys measured by SPR where spike protein was immobilized (~100 RU) on the sensor chip. The sensorgrams illustrate the avidity gain afforded by multivalent ACE2 scaffold based on the decreasing off-rate with increasing ACE2 valency. (c) Multivalent ACE2 decoys bind SARS-CoV-2 spike protein RBD with higher avidity as sensor chip surface Wuhan (WT) spike RBD ligand level increases. (left) The apparent KD of multivalent ACE2 decoys measured for different RBD ligand densities shows the effect of avidity as increasing concentrations of immobilized spike RBD results in tighter binding. The KD of monovalent IgG OAA ACE2 decoy did not change significantly with changing RBD ligand density. The association (ka; middle) and dissociation (kd; right) rates measured are plotted against the different immobilized RBD ligand densities. The dashed limit represents the LOD. Apparent KD values are reported for multivalent ACE2 decoys as binding curves are fit by 1:1 kinetic model.
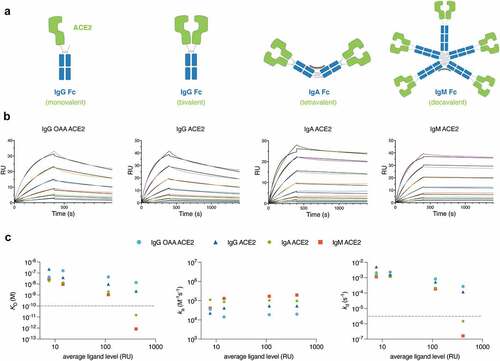
Table 1. Binding kinetics of ACE2 decoy variants and clinical comparators to recombinant spike protein RBD as measured by SPR.
Figure 2. Neutralization of SARS-CoV-2 variant spike protein and ACE2 binding by ACE2 decoys and REGEN-COV mAb cocktail by blocking immunoassay, pseudovirus, and live virus neutralization assays.
(a) MSD immunoassay of SARS-CoV-2 Wuhan (WT), Delta (B.1.617.2), and Omicron (B.1.1.529) spike protein binding to SULFO-tagged ACE2. (b) Neutralization of SARS-CoV-2 pseudovirus displaying Wuhan (WT), Delta (B.1.617.2), or Omicron (B.1.1.529) spike proteins from entering ACE2 expressing Opti-HEK293 cells. REGEN-COV cocktail was composed of a 1:1 combination of casirivimab and imdevimab each added at the concentration indicated. (c) Live virus neutralization assay to block SARS-CoV-2 Delta (B.1.617.2) infection of ACE2 expressing Calu-3 cells. Calu-3 cells were stained with crystal violet and viability was determined by measuring absorbance at 570 nm. (d) Table summarizing the IC50 (MSD immunoassay and pseudovirus neutralization) and MN50 (live virus neutralization) values calculated for ACE2 decoys and REGEN-COV in each assay.
(A) Percent neutralization titration curves from MSD-based immunoassay for IgG OAA, IgG, and IgM ACE2 decoys have consistent potency and rank order across SARS-CoV-2 variants Wuhan (WT), Delta (B.1.617.2), Omicron (B.1.529), and Omicron (BA.5) compared to REGEN-COV which loses potency across the variants (in the order described) for blocking recombinant ACE2 from binding variant spike proteins. (B) Percent neutralization titration curves from a pseudovirus assay show how IgG and IgM ACE2 decoys maintain consistent potency preventing pseudovirus expressing SARS-CoV-2 Wuhan (WT), Delta (B.1.617.2), or Omicron (B.1.529) spike protein from infecting ACE2 expressing cells, but that potency of REGEN-COV decreases across variants in the order described. (C) Titration curves of IgG and IgM ACE2 decoys, REGEN-COV, and isotype controls demonstrate that IgM ACE2 decoy can neutralize SARS-CoV-2 strain Delta (B.1.617.2) live virus from infecting ACE2 expressing Calu-3 cells at a potency comparable with REGEN-COV. (D) Heat map of IC50 values obtained for ACE2 decoys and mAb benchmarks in MSD-based neutralization immunoassay illustrates the consistent potency of ACE2 decoys across different SARS-CoV-2 variant spike proteins in contrast with variable potency of clinical mAb benchmarks.
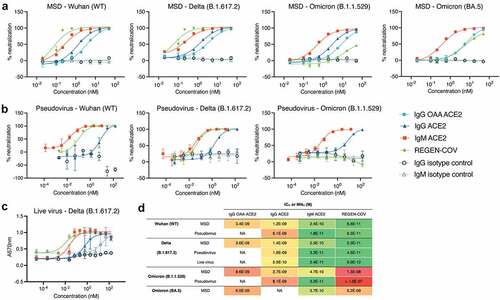
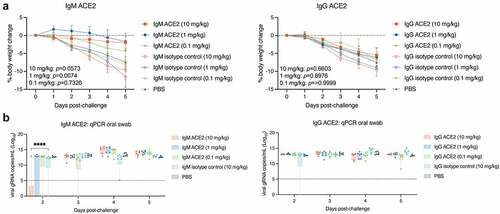
Figure 3. In vivo efficacy of intranasal IgM ACE2 decoy and IgG ACE2 decoy for treatment of SARS-CoV-2 Delta (B.1.617.2) infection in a Syrian hamster model.
(A) Graph of hamster weight loss after infection with SARS-CoV-2 Delta (B.1.617.2). IgM ACE2 decoy at the highest doses of 1 mg/kg and 10 mg/kg appear to prevent weight loss of hamsters compared to isotype controls and IgG ACE2 decoys. (B) Graph of viral gRNA copies from nasal swabs after SARS-CoV-2 Delta (B.1.617.2) infection shows a significant decrease on day 2 for hamsters treated with IgM ACE2 decoy.
(a) Impact of intranasal treatment with IgM ACE2 or IgG ACE2 decoy on body weight change after viral challenge. P values indicated are based on statistical difference between treatment groups and dose-matched isotype controls on day 5. Error bars represent standard error of the mean. (b) Impact of ACE2 decoy treatment on viral RNA quantified from hamster oral swabs at days 2, 3, 4, and 5 post-challenge (**** indicates significant differences with p < 0.0001). Data is plotted as box-and-whisker plot and the dotted line represents the limit of detection (LOD = 5 viral gRNA copies/ml (Log10)).
Supplemental material