Figures & data
Figure 1. IL-38 is targeted by B cells in cancer patients and is highly expressed in multiple tumor types. (a) Identification of IL-38 as the specific target of IMM20130 assessed by protein microarray. Binding signal and S-Scores shown for the top 200 proteins based on binding signal. (b) Assessment of IL-38 transcript expression in tumor and normal tissue using TCGA RNAseq data. Samples were normalized for IL-38 expression and subdivided based on high (brown) and low (green) expression using thresholds set according to a value of 10–15% of normal tissues. Numbers in each plot represent frequency of IL-38 positive samples in all tumor samples using this threshold. (c) Immunohistochemical analysis of IL-38 expression in three cancer types. Head and neck squamous carcinoma (HNSC), lung tumors comprising multiple subtypes including adenocarcinoma and squamous cell carcinoma, and cervical squamous carcinoma (CESC) were stained with IMM20324 or isotype control antibodies to detect IL-38 expression. Pathological scoring was performed according to staining density. Representative examples of specimens with a range of expression intensity within each indication are shown. (d) Average intensity of IL-38 expression across cancer indications tested. Intensity scoring analysis was performed using a 7-point scale, with 0 corresponding to no expression and 6 being strong staining. Scoring was performed in both cytoplasmic and nuclear compartments and averaged to calculate final scores.
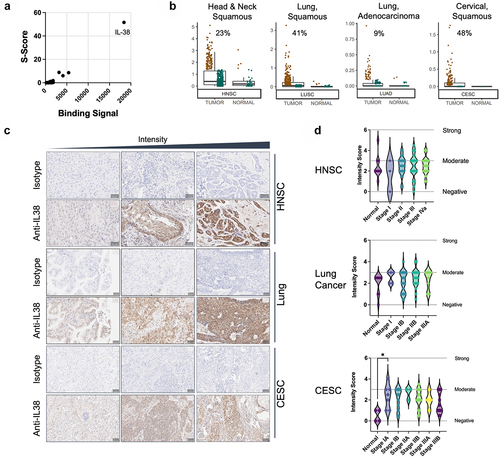
Figure 2. IL-38 expression is associated with reduced immune infiltration and HPV status in head and neck squamous carcinoma. (a) Signature analysis of immune lineages in IL-38 high versus IL-38 low head and neck tumors. Negative values represent reduced expression of lineage-associated genes and lower infiltration. Positive values represent increased infiltration of indicated lineages. HNSC: head and neck squamous cell carcinoma; LUSC: lung squamous cell carcinoma; ESCA: esophageal carcinoma: LUAD: Lung adenocarcinoma; CESC: cervical squamous cell carcinoma and endocervical adenocarcinoma: SKCM: skin cutaneous melanoma. (b) IL-38 expression in HPV-negative and HPV-positive populations of head and neck cancers.
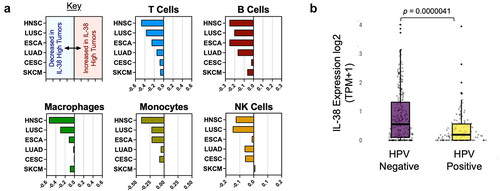
Table 1. IL-38 expression in selected cancer types using Tempus data.
Table 2. IL-38 expression is associated with immune cell infiltration in selected cancers.
Figure 3. IMM20324 is specific for IL-38, binds human and mouse protein with different affinities and neutralizes binding to putative human IL-38 receptors. (a) Identification of IL-38 as the specific target of IMM20324H assessed by protein microarray. Binding signal and S-scores shown for the top 200 proteins based on binding signal. (b) (Top) Binding of recombinantly produced IMM20324 mIgG2a antibody to recombinant human and mouse IL-38 using BLI. Two-fold titrations (1.52–0.095 µM) were performed to generate KD values for binding to species-specific proteins. (Bottom) Values shown are average of two experiments. (c) ELISA-based binding analysis of IMM20324 to recombinant full-length human and mouse IL-38 using direct ELISA. (d) Flow cytometry-based binding to human and mouse IL-38 overexpressing CHO cells. Cells were fixed and permeabilized to assess binding of intracellular IL-38. Mock-transfected controls, in addition to isotype staining controls for human (gray) and mouse (black) cells also shown on graph. (e) Inhibition of IL-38 receptor binding to its receptors. Inhibition of binding to IL-36R is shown in the circles, IL1RAPL1 is shown in squares. Isotype control-treated samples are in blue, while samples treated with IMM20324 are shown in red.
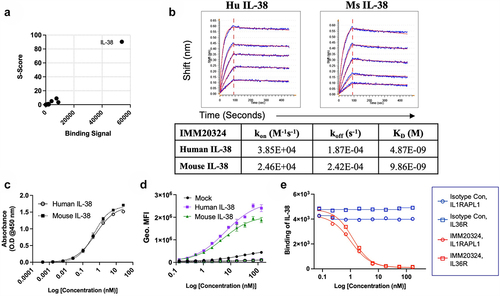
Figure 4. IMM20324H exhibits favorable PK profile and is well tolerated in non-tumor-bearing mice. (a) In vivo pharmacokinetic analysis of IMM20324H following administration of antibody by intravenous (IV) and intraperitoneal (IP) routes performed in C57BL/6 mice. Dose shown is 10 mg/kg. (b) Analysis of serum IMM20324H concentrations on D21 following administration of antibody by IP injection. Groups were dosed once weekly (QW) or twice weekly (Q2W) with the labeled dose in mg/kg. (c) Average body weight of animals from each treatment group was monitored throughout the duration of the study (d) Average spleen weights of animals comprising each treatment group were assessed upon study termination on D21. (e) Assessment of circulating cytokine levels in serum following administration of IMM20324H. Blood was sampled following study termination. Data presented as log2 transformation of the cytokine concentration+1. Dotted line indicates the lower limit of quantification (LLOQ) at 10 pg/mL.
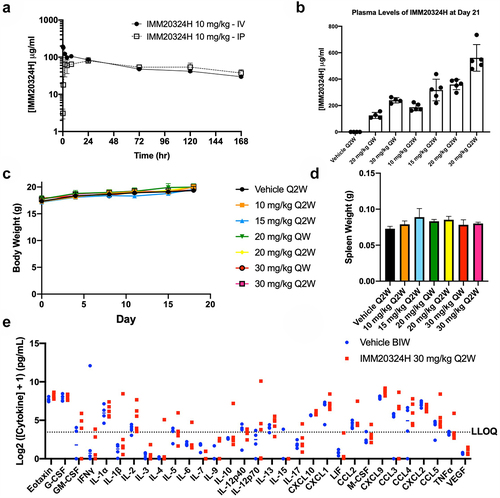
Figure 5. Targeting of IL-38 inhibits tumor growth and elicits immunological memory against EMT6 breast tumors in vivo. (a–e) Mice were randomized at D1 based on tumor volume and treated with three different doses of IMM20324H or a PBS vehicle control twice per week for 6 total doses. (a) Mean tumor volume up to D17 (b) Tumor volume on D17, the final day all mice were on study. (c) Individual growth curves for each mouse in the indicated group up to D45. (d–e) EMT6 cells were implanted into the opposite flank of IMM20324H-treated mice following full regression of the primary tumor. No additional antibody was administrated during secondary challenge. (d) Secondary EMT6 tumor growth curves compared to untreated age-matched mice. (e) Survival curves of rechallenged mice showing % survival per group. *p <0.05.
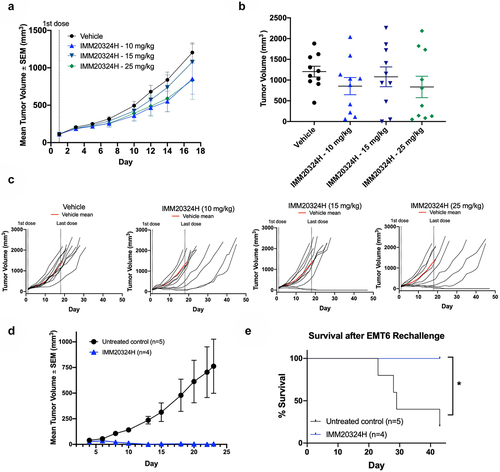
Table 3. Linear mixed effects modeling of IMM20324H treatment in the EMT6 syngeneic model.
Figure 6. IMM20324 inhibits growth of B16.F10 tumors in vivo. (a–e) Mice were randomized at D0 based on tumor volume and treated with 10 or 50 mg/kg dose of IMM20324 or isotype control intraperitoneally every 3days for six total doses. Tumor volumes were measured every 3 days. Tumor growth curves were fitted with exponential model. (a) Mean tumor volume up to D 10. (b) Interim tumor volumes of individual animal on D10. (c) Growth curves of individual animal from the indicated group over the duration of the study. (d) Calculated average tumor growth rate over the duration of study. (e) Calculated days when tumor volume reaches 1500 mm3 based on fitting of tumor growth curve. * p < 0.05, ** p < 0.01, ns = not significant.
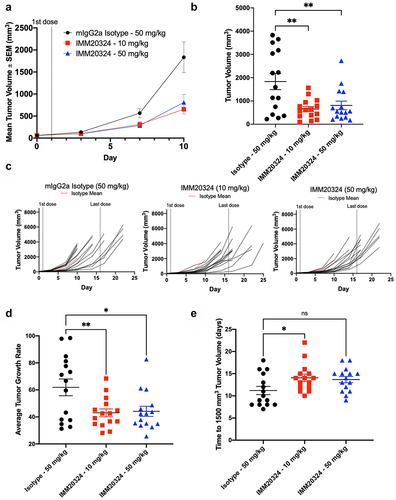
Table 4. Linear mixed effects modeling of IMM20324 treatment in the B16.F10 syngeneic model.
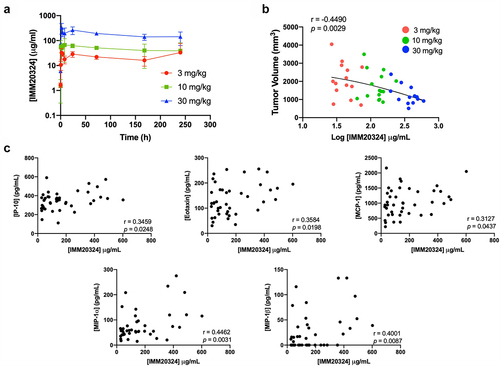
Figure 7. IMM20324 treatment decreases tumor volume and increases intra-tumoral chemokines in a dose-dependent manner. (a) B16.F10 tumor-bearing mice given a single dose of IMM20324 at 3, 10, or 30 mg/kg and mice were bled at indicated timepoints. IMM20324 exposure was measured by ELISA and plotted over time (n = 3 mice per timepoint). (b) Mice were randomized at D0 based on tumor volume and treated indicated dose of IMM20324 or isotype control intraperitonially every 3 days for four total doses. Mice were taken down on D11, 24 hours after the final dose. Terminal exposure of IMM20324 was plotted against tumor volume on D11. (c) Intra-tumoral chemokine concentrations detected by Luminex analysis. Mice in all IMM20324 treatment groups are shown. r and p values were calculated using Pearson correlation co-efficients.