Figures & data
Figure 1. Amino acid sequences of VHH domains. VHH sequences include the anti-RNase A VHH “framework” (cAbrn05) domain,Citation5 the original anti-caffeine VHH by Ladenson et al. (Caff),Citation18 the anti-caffeine VHH produced through grafting CDR regions (Caffgraft)Citation20 examined in this study, an anti-picloram VHH (Picloram),Citation24 an anti-GFP VHH (GFP),Citation25 and an anti-HIV1 capsid protein C-terminal domain VHH (PDB ID: 2xV6). Grey highlighting: anti-caffeine residues introduced into segments of CDR loops of anti-RNase A VHH; underlined residues: anti-RNase A residues that remained post-grafting; bold italicized residues: residues mutated in this study to explore disruption of VHH homodimer.
Figure 2. Structure of caffeine/anti-caffeine VHH homodimer complex. (a) Homodimer stick structure highlighting caffine binding site and conserved water molecules within VHH:VHH interface. (b) Close up of caffeine binding site. Image is rotated 90° vertically from panel A. Y32 sidechains from both VHH domains, which are are shown in stick (foreground) and space fill (background), “sandwich” the caffine ligand. (c) Electron density map (2FoFc) of caffeine/CDR3-binding pocket with water mediated hydrogen bond. Map coutoured at 2σ. (d) Side and top view perspective of the VHH complex. VHH domains (white and gray); caffeine (magenta); interface mutations F47R (cyan), V100R (green), and Y(100B)R (orange); Kabat numbering is use for residue positions. Caffeine shown in magenta in all panels.
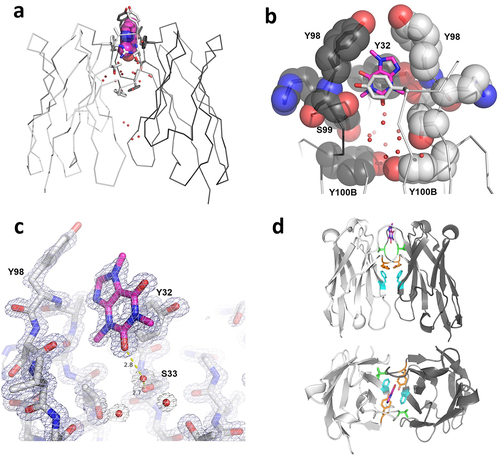
Table 1. Crystallography and refinement details for VHH/caffeine complex.
Table 2. Dimer interface hydrogen bond contacts.
Table 3. Thermodynamic data for anti-caffeine binding to xanthine analogues. Data for three arginine incorporations binding to caffeine are also shown.
Figure 3. Analytical ultracentrifugation analysis of anti-caffeine VHH dimer assembly. (a) Sedimentation coefficient distribution plots for wt. VHH alone, wt VHH with stoichiometric caffeine, and F47R VHH. Each protein was loaded at a concentration of 30 µM, and the caffeine concentration for the second sample was 15 µM. (b) Sedimentation equilibrium data for wt VHH. (c) Sedimentation equilibrium data for wt VHH with stoichiometric caffeine. (d) Sedimentation equilibrium data for F47R VHH with stoichiometric caffeine. All equilibrium experiments were conducted using protein samples at 3, 10, and 30 µM, with stoichiometric levels of caffeine (1.5, 5, and 15 µM) as required. The fits shown for each sample are the result of global analysis of all three speeds and concentrations; for clarity, only the 10 µM data at each speed are plotted.

Figure 4. Thermodynamic model and temperature profile for anti-caffeine VHH dimer dissociation. (a) Linked thermodynamic model consisting of dimerization, Kdimer, followed by caffeine binding to the VHH dimer species, Kbind. (b) Plot of ΔH°obs as a function of temperature for VHH:VHH dissociation. (c) Plot of ΔG°obs as a function of temperature for VHH:VHH dissociation based on obtained dimer dissociation thermodynamic parameters. Includes data from AUC experiments at 20° for comparison. Error bars represent 95% confidence intervals. Note: Thermodynamic terms for ΔH°obs and ΔG°obs presented in panels B and C represent the dimer dissociation reaction, which is the opposite direction of Kdimer presented in panel A.
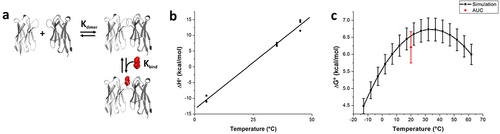
Figure 5. Structural differences between the anti-caffeine VHH homodimer and conventional VH/VL heterodimers. (a) Surface area burial heat map for residues within the anti-caffeine VHH:VHH (left) and a representative VH:VL dimer (right; PDB ID: 1Q72)Citation26. (b) Structural overlay of a VHH domain from the anti-caffeine structure with the VH domain from a murine anti-cocaine Fab (PDB entry 1Q72). The VH and VHH domain alignment is in background (gray) and the VL domain from anti-cocaine (blue) and second VHH domain from anti-caffeine VHH (red) are in foreground. Average angle between principal axes is calculated from four anti-caffeine dimers and a sampling of VH:VL structures from the PDB 1Q72, 2JB6, 2UUD, 3CFB, 3FO9).
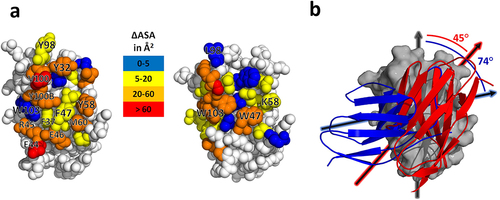
Table 4. Surface area burial of VH:VL and VHH:VHH antibody dimers in Å2.
Figure 6. Stereoview image displaying the difference in CDR3 conformation between anti-caffeine VHH domain and a conventional anti-RNase a VHH. VHH domains have been superimposed and anti-RNase a framework omitted for clarity. CDR3 loop color coded: anti-caffeine VHH (red) and anti-RNaseA VHH (cyan). Framework residues that experience greater solvent exposure due to displaced CDR3 are highlighted in green sticks. Caffeine ligand is displayed in stick form at top of image (carbon-green).
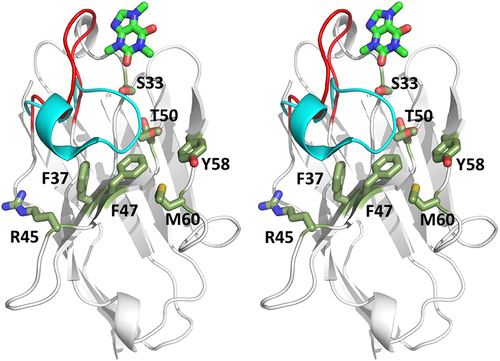
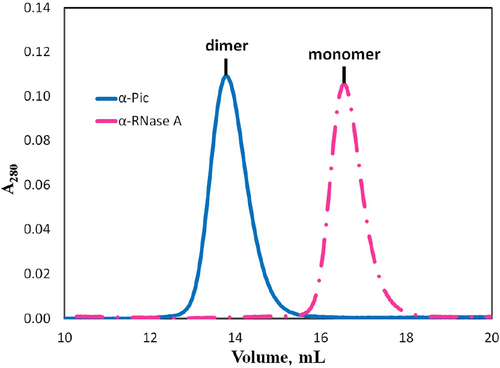
Figure 7. Normalized size exclusion profile of anti-picloram versus monomeric anti-RNase a VHH domains. Anti-RNase a (dashed pink) and anti-picloram VHH (solid blue).