Figures & data
Figure 1. The mechanism of aspartic acid isomerization via the formation of a succinimide intermediate (Asu). Theoretical monoisotopic masses of Asp, isoAsp residues and the succinimide intermediate are indicated.
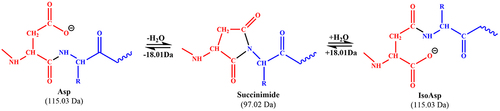
Figure 2. Identification of the charge variants in mAb-a pre-incubated under different pH conditions. (A) Cation-exchange HPLC (CEX) profiles of mAb-a pre-incubated at different pH values (pH 5.0, 6.0, and 7.0) and 25°C over a period of 5 days. The two basic peaks with significant intensity increases after acidic pH pre-incubation, B1 and B2, are indicated in the chromatograms. (B) Identification of B1 peak and B2 peak in pH5, 5 day treated mAb-a by intact mass analysis. The B1 peak has 18 Da lower mass while B2 peak has 36 Da lower mass compared to the main peak.
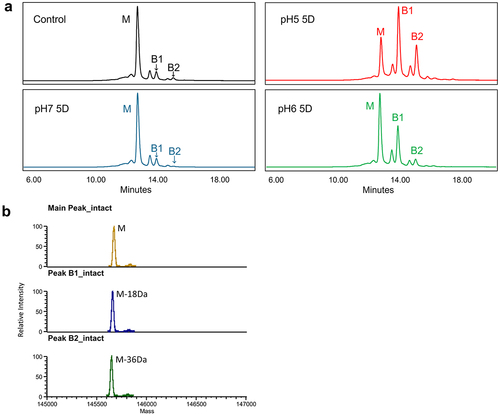
Table 1. CEX and post-translation modification (PTM) analyses of mAb-a pre-incubated under different pHs.
Figure 3. Extracted ion chromatograms of tryptic peptides of mAb-a that were pre-incubated at pH 5.0, 6.0, or 7.0 over five days and contain either aspartate, iso-aspartate, or succinimide (A). The figure also includes MS/MS spectra of the tryptic peptides that contain aspartate or iso-aspartate (B) and succinimide (C) located at amino acid residue position 55. The spectra and chromatograms indicate the presence of Asp55 isomerization products in the samples.
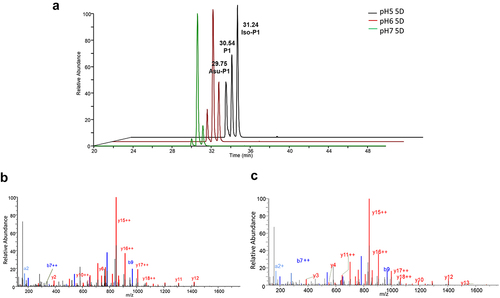
Figure 4. The relative binding potency of mAb-a to target cells as measured by FACS. Panel a illustrates the varying potency of mAb-a samples, which were pre-incubated at different pHs to obtain different proportions of Asp55 isomerization. The different treatment conditions are color-coded (red for pH 5.0, blue for pH 6.0, and black for pH 7.0). The pre-incubation time are plotted on the x-axis, while the corresponding potency levels are on the y-axis. Panel B shows the correlation between the level of Asp55 modification (IsoD+asu%) and the binding potency of mAb-a.
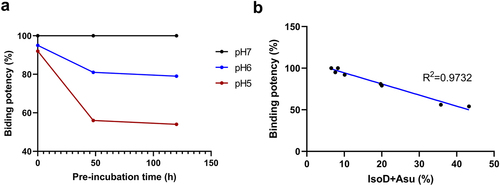
Figure 5. The workflow of affinity capture LC-MS assay. Use immunoprecipitation with antigen to recover mAb-a from rat plasma. Following IdeS cleavage and tryptic digestion, peptides, including the liability peptide containing Asp55 residue, are detected using LC – MS/MS.
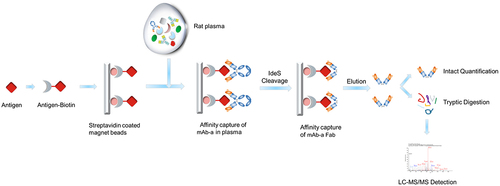
Figure 6. Time-dependent changes in the proportion of mAb-a isomerization product (IsoD) after dosing in SD-rats. mAb-a was pre-incubated at different pH levels (pH 5.0, 6.0, and 7.0) for five days before intravenous injection in rats to achieve varying starting levels of Asp55 isomerization. At the indicated time point, mAb-a was affinity captured from rat plasma and analyzed by LC-MS peptide mapping to measure the percentage of IsoD. The lines representing the mAb-a pre-treatment conditions are color coded. (red for pH 5.0, blue for pH 6.0, and black for pH 7.0).
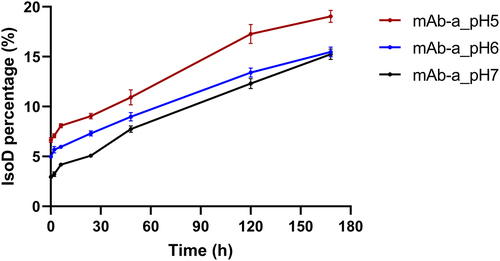
Figure 7. Rat pharmacokinetics of mAb-a pre-treated under indicated pH conditions. Antibody serum concentrations are plotted against time post dosing in rat. A single intravenous dose of 10 mg/kg of mAb-a was administered to SD-rats. Results are presented as mean ± SD (n = 3 rats per time point × 2 replicate measurements).
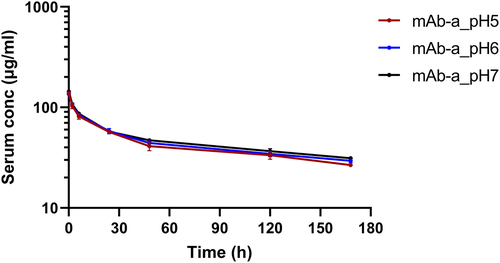
Table 2. Pharmacokinetic parameters of all stressed mAb-a in SD-rats.
Figure 8. Isomerization reaction results of a synthetic peptide (P1) corresponding to the tryptic peptide found in mAb-a. The peptide was incubated for seven days at 25°C under indicated pH conditions. (red line: incubated at pH 5.0; blue line: incubated at pH 6.0; and black line: incubated at pH 7.0).
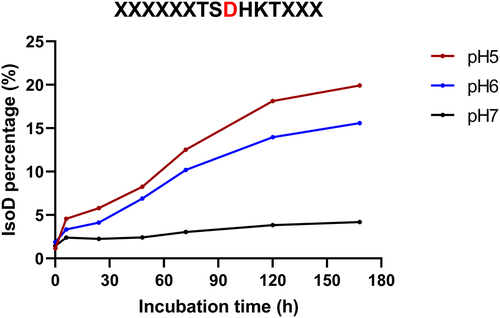
Figure 9. Isomerization reaction results of Asp55 in the synthetic P1 and mutant peptides incubated at pH 5.0 at 25°C for seven days.
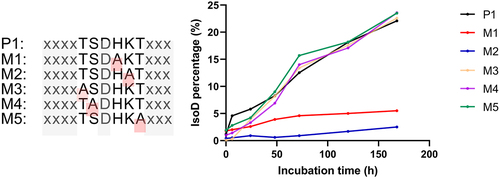
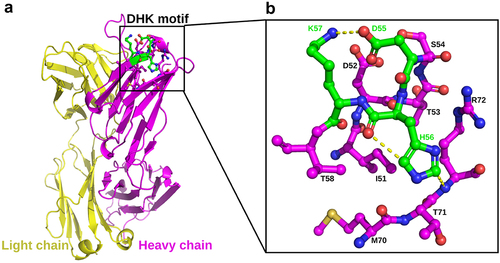
Figure 10. The crystal structure of mAb-a Fab (PDB:8JBJ). (A) Overall structure of mAb-a Fab region, with the heavy chain in magenta and the light chain in yellow. The DHK motif, located in the HCDR2 is highlighted in green. (B) a detailed view of the DHK motif and its surrounding residues. All residues are depicted in stick form, and hydrogen bonds are indicated by yellow dash lines.