Figures & data
Figure 1. In vitro characterization of new anti-CEA antibodies. (a) SPR sensorgram of G9, F7, and F4 in a scFv format. KD values were calculated to be 640 nM, 50 nM, and 7.7 nM, respectively. (b) Flow cytometry analysis with the new antibodies in IgG format on CEA-expressing CT26 cells and on CEA-negative CT26 wild-type cells. (c) Immunofluorescence staining with IgG formats on the human colon adenocarcinoma xenograft LS174T. Anti-CEA antibodies were detected in green. Blood vessels were detected by CD31 staining (red). 20× magnification, scale bars = 100 μm.
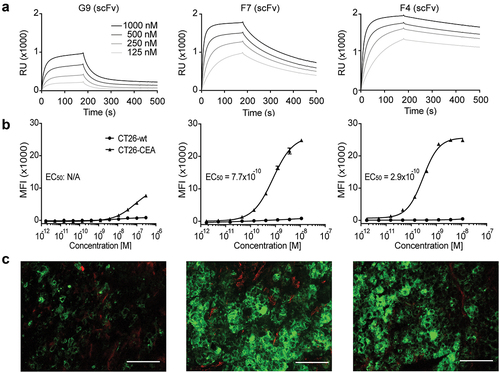
Figure 2. Immunofluorescence analysis of human cancer sections. Human tissue microarrays with cancer sections and corresponding healthy controls were analyzed by immunofluorescence analysis with F4, the positive control Sm3E, and an irrelevant isotype control (KSF). Antibody binding was detected in green. Blood vessels were detected with CD31 staining (red) and nuclei with DAPI (blue). 20× magnification, scale bars = 100 μm.
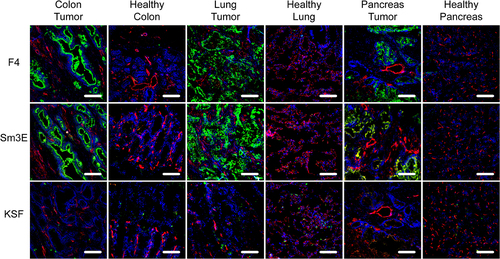
Figure 3. Ex vivo immunofluorescence-based biodistribution analysis. Immunofluorescence analysis assessed tumor targeting of new anti-CEA antibodies in IgG format. Two hundred micrograms of IgG-FITC were injected intravenously into LS174T-bearing mice. Tumors were excised 24 hours after injection. IgG-FITC was detected in green; blood vessels were detected through CD31 staining (red). 20× magnification, scale bars = 100 μm.
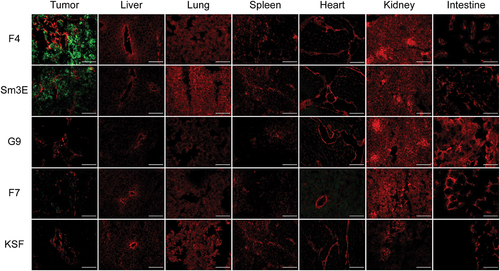
Figure 4. Quantitative biodistribution with radiolabeled anti-CEA antibodies in diabody format. Quantitative biodistribution analysis of radio iodinated anti-CEA diabodies in BALB/c nude mice bearing subcutaneous LS174T colon adenocarcinomas. Organs were harvested 24 hours after intravenous injection, and radioactivity was quantified. Results are shown as the percentage of injected dose per gram (ID/g (%)). Error bars = SEM; n = 4.
Figure 5. Preclinical characterization of F4-IL12. (a) Schematic representation of F4-IL12. P35 and p40 of murine IL12 were genetically linked to F4 in single-chain diabody format. (b) Surface plasmon analysis of F4-IL12 on recombinant CEA. (c) IFNγ release assay with F4-IL12 on murine splenocytes. (D and G) Flow cytometry analysis on CEA+ CT26 (d) and C51 (g) cells. As a negative control, cells were treated with the detecting secondary antibody only. (E and H) Tumor growth of (e) CT26-CEA bearing BALB/c mice treated with 3 × 12 μg F4-IL12, KSF-IL12, or saline (n = 3) and (h) C51-CEA bearing BALB/c mice treated with the same compounds (n = 8). Mice were randomized when tumors reached an average volume of 100 mm3. Arrows indicate days of injection. †=mouse excluded due to ulceration. Bodyweight change of treated mice bearing (f) CT26-CEA tumors and (i) C51-CEA tumors. Error bars = SEM.
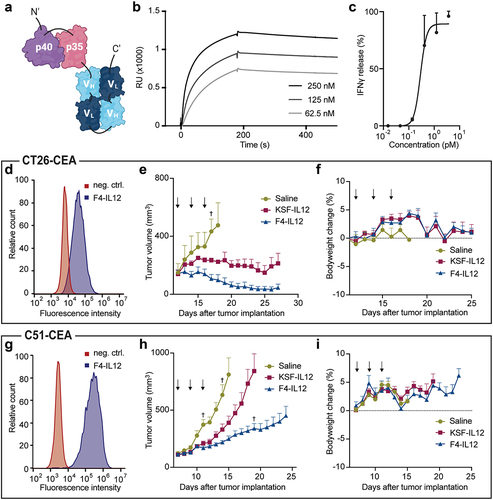
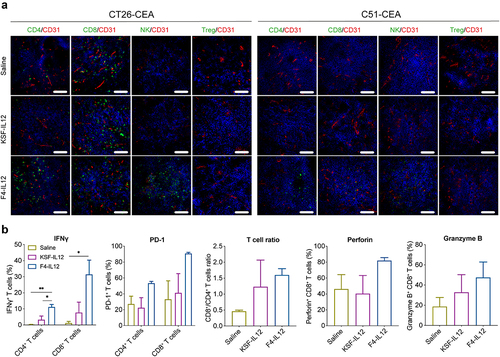
Figure 6. Ex vivo analysis of F4-IL12 treated tumor-bearing mice. (a) Analysis of tumor-infiltrating lymphocytes in CT26-CEA (left) and C51-CEA (right). Tumors were removed 48 hours after the third injection and analyzed by immunofluorescence staining. Markers specific for CD4+ T cells (CD4), CD8+ T cells (CD8), Natural killer cells (NKp46), and regulatory T cells (Foxp3) were used (green). Vasculature was visualized through CD31 staining (red) and nuclei with DAPI (blue). 20× magnification; scale bar = 100 μm. (b) Phenotype analysis of CD4+ and CD8+ T cells in the tumor of treated C51-CEA bearing mice. Tumors were removed 48 hours after the third injection. Bar plots show expression levels of IFNγ, PD-1 (both in CD4+ and CD8+ T cells), the ratio of CD4+ and CD8+ T cells, and expression of Perforin and Granzyme B in CD8+ T cells. Statistical differences were assessed between mice receiving saline, KSF-IL12, and F4-IL12. *p < 0.05; **p < 0.01 (regular one-way ANOVA test with Tuckey posttest). Error bars = SEM; n = 3.