Figures & data
Figure 1. Generation and characterization of E1P2 monoclonal antibody. (a) Schematic representation of the phage display selection strategy to isolate new mAbs toward human CD28. The recombinant human CD28 protein was engineered with a biotin tag close to the superagonistic region (C’’D loop), to favor the isolation of binders toward the apex of CD28. (b) IgG4(E1P2) shows a pure protein with the expected molecular weight in the SEC (left) and SDS-PAGE (right). (c) Binding of IgG4(E1P2) and TGN1412 to primary human and mouse T cells by flow cytometry. Only E1P2 bound to both human and mouse T cells (with 18-fold lower apparent affinity to mouse CD28). Data are presented as mean±SD of technical triplicates from three independent flow cytometry measurements. MFI was calculated, and the sigmoid curve for antibody concentration (x-axis) against relative MFI (y-axis) was plotted and fitted using a 4-parameter logistic (4PL) non-linear regression model to calculate the EC50 values.
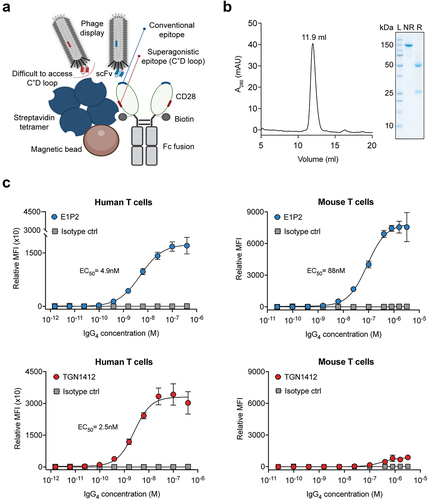
Figure 2. Epitope mapping of E1P2 using SPOT technology. (a) The binding regions of E1P2 (highlighted in light and dark blue) are different from that of TGN1412 (highlighted in red). (b) A cellulose membrane with overlapping peptides covering the ECD of human CD28 was used to highlight the binding epitope. E1P2 binds to the apex of CD28 close to the natural binding site of CD80/CD86 (near the MYPPPY region), unlike TGN1412, which was previously shown to bind to a lateral epitope (PDB: 1YJD). The binding spots of E1P2 on the cellulose membrane show a conformational epitope since two different regions were positive. (c) Sequence alignment of human/cyno/mouse CD28 with the potential binding residues of E1P2 highlighted in blue. The non-identical sequence between human/cyno/mouse CD28 is indicated with an asterisk (*).
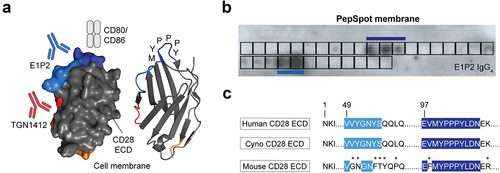
Figure 3. In vitro superagonistic assay on human PBMCs. (a) A graphical representation for the binding mode of conventional mAbs like E1P2 (top) and superagonistic mAbs like TGN1412 (bottom). Antibodies were wet coated on 6-well plates (6μg/well), and human PBMCs from a healthy donor were added (1.5 million/well). (b) A significant proliferation of PBMCs was observed using an MTS assay in the presence of TGN1412, but not E1P2, after 5 days. (c) Different pro-inflammatory cytokines (IL-2, IFN-γ, and TNF-α) were quantified by ELISA after 3 days. No cytokines were elevated after adding E1P2, unlike TGN1412. (d) The expression of an early activation marker (CD69) and a late activation marker (CD25) was assessed by flow cytometry on CD4+ and CD8+ T cells after 3 days. Activations markers were only elevated in the presence of TGN1412, but not E1P2. Data are presented as mean±SD. Each dot represents the value of a technical replicate. Statistical analysis of the data was performed by one-way ANOVA followed by Tukey’s multiple comparison test.
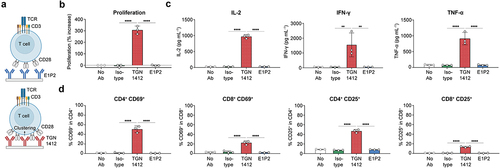
Figure 4. In vitro co-stimulation assay with anti-CD3 antibodies. Freshly thawed human PBMCs from a healthy donor were used to test the activity of IgG4(E1P2) in combination with either an anti-CD3 mAb (OKT3) or an anti-CD3/anti-EDB BiTE. (a) OKT3 was wet coated on 6-well plates (2μg/well), and antibodies (E1P2 IgG4, TGN1412, or isotype control) were added to the solution (15μg/well) with human PBMCs. (b) A 2-fold increase in cell proliferation was observed when IgG4(E1P2) was combined with OKT3, in comparison to when an isotype control was combined with OKT3. (c) Minimal secretion of cytokines was seen when adding OKT3 alone to human PBMCs, especially IL-2. A 100-fold increase in IL-2 secretion, a 10-fold increase in IFN-γ secretion, and a 5-fold increase in TNF-α were observed when combining IgG4(E1P2) with OKT3. (d) EDB+ WI-38 cells were used as target cells to examine the synergistic effect in an in vitro killing assay. Human PBMCs were added (effector to target ratio of 5:1) in the presence of different concentrations of anti-CD3/anti-EDB BiTE, and in the presence or absence of IgG4(E1P2) or controls. (e-h) A potent synergistic effect was observed as reflected in target cell lysis, CD25 expression, IFN-γ release, and cell proliferation. The activity seen with IgG4(E1P2) was only in combination with CD3 bispecific antibodies, unlike the superagonistic TGN1412 antibody that showed nonspecific activation. Data are presented as mean±SD (n=3 from technical replicates). Statistical analysis of the data was performed by one-way ANOVA followed by Tukey’s multiple comparison test (B&C) or by two-way ANOVA followed by Dunnett’s multiple comparison test (E-H).
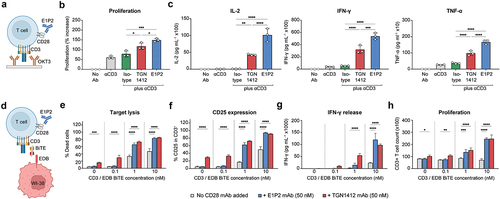
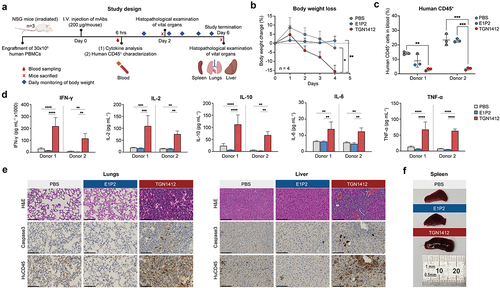
Figure 5. In vivo safety study in humanized NSG mice. (a) The study design for the in vivo toxicity experiment highlighting the important milestones. NSG mice were humanized by engrafting 30x10Citation6 human PBMCs from two different healthy donors. IgG4(E1P2), TGN1412, or PBS were injected, and a blood sample was taken after 6 hours to measure serum cytokines and to characterize the human CD45+ population. After 2 and 6 days, mice were sacrificed, and organs were examined for histopathological findings. (b) The TGN1412 group exhibited severe body weight loss upon treatment. (c) The human CD45+ population rapidly declined after the administration of TGN1412, but not E1P2. (d) Serum cytokines were quantified after 6 hours, and significant elevation was observed after injecting TGN1412, unlike E1P2. (e) Histopathological examination of vital organs after 6 days using H&E, Caspase3, and human CD45 staining. Necrotic tissues were observed in the TGN1412 group, but not in the E1P2 group. (f) The size of the spleen was measured by a ruler after 2 days, and splenomegaly was observed only after administering TGN1412. Representative data from two mice are shown in E and F. Data are presented as mean ± SD (n=3 from technical replicates, except in B in which n=4 from biological replicates). Statistical analysis of the data was performed by two-way ANOVA followed by Dunnett’s multiple comparison test (B-D). *p < 0.05; **p < 0.01; ***p < 0.001;****p < 0.0001. Scale bar: 100 µm.