
Figures & data
Figure 1. Schematic diagram of FAST-Ig concept (a) for correct pairing of HC/LC, residues in the interface of HC/LC are substituted by oppositely charged paired residues. For promoting HCs-heterodimerization, KiH or pairs of charged residues such as E356K/K439E (ART-S3), which was used in the previously reported ART-Ig design,Citation5,Citation28,Citation29 are introduced (numbering of CH was defined by Eu numbering.Citation36 VH, VL and CL were defined by Kabat numberingCitation37 in this paper). (b) Ten possible pairing patterns of BsAbs with four different chains in a single-cell expression of wild type IgG. Preferential chain pairings of BsAb with FAST-Ig mutations along with the image of the result of ion exchange chromatography are shown. The expression of nine types of mispairs will be suppressed by FAST-Ig. The antibody with desired pairing is highlighted by red square.
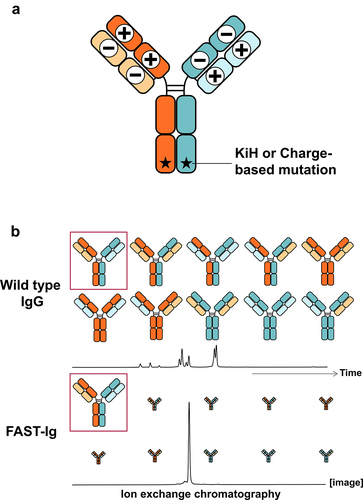
Table 1. CH1 and CL variants with single pair of charged residues to promote the correct assembly of HCs and LCs of parent NXT007 in a single host cell. The four plasmids encoding the HCs and LCs of anti-FIXa (IgG4, kappa) and anti-FX (IgG4, lambda) antibodies were co-transfected into Expi293F cells with three plasmid weight ratios, H1:L1:H2:L2 = 1:3:1:1, 1:1:1:1, 1:1:1:3. Then, the cell culture supernatants were purified by protein A affinity chromatography and analyzed by cation exchange chromatography. The target BsAb yield was calculated by peak area ratios of chromatogram as described in Figure S2. To promote heterodimerization of HCs, knob mutations (Y349C, T366W) and hole mutations (E356C, T366S, L368A, Y407V) were introduced in anti-FIXa HC and anti-FX HC, respectively. Data shown represent mean ± SD for two or more independent experiments.
Table 2. CH1 and CL variants with multiple pairs of charged residues to promote the correct assembly of HCs and LCs of parent NXT007 in a single host cell. The four plasmids encoding the HCs and LCs of anti-FIXa (IgG4, kappa) and anti-FX (IgG4, lambda) antibodies were co-transfected into Expi293F cells with three plasmid weight ratios, H1:L1:H2:L2 = 1:3:1:1, 1:1:1:1, 1:1:1:3. Then, the cell culture supernatants were purified by protein A affinity chromatography and analyzed by cation exchange chromatography. The target BsAb yield was calculated by peak area ratios of cation exchange chromatography as described in Figure S2 and Table 1 legends. Data shown represent mean ± SD for two or more independent experiments.
Figure 2. Detailed characterization of the selected FAST-Ig variants (a) the efficient interchain disulfide bond formation of BsAbs with FAST-Ig mutations was confirmed by non-reducing SDS-PAGE analysis. 2.5 µg BsAb/lane was applied onto Mini-Protein TGX gel 4–20% (Bio-Rad) and stained by Quick-CBB (Wako). (b) Size exclusion chromatography confirmed the same high level of monomer ratio of BsAb (about 150 kDa) among all selected FAST-Ig variants. The antibodies purified by protein A were used for the analysis. (c) Detailed analysis of the BsAb yield of parent and FAST-Ig variants (C1-C4). The antibodies were expressed by changing the plasmid mass ratio of L1 and L2 while H1 and H2 were fixed at 1:1 (Total plasmid amount was fixed as 1 µg for 1 mL Expi293F transient expression). Data was obtained from three independent experiments and are expressed as mean ± SD. Data could not be obtained in C4 with L1:L2 = 1:8 ratio due to the low expression level. (d) Antibody yields after protein A purification were compared among parent and BsAbs with FAST-Ig mutations (C1-C4) in the same expression condition as (c). Data was obtained from three independent experiments and are expressed as mean ± SD (e) NXT007 with different FAST-Ig variants showed FVIII-mimetic activity comparable to that of the parent and to BsAbs prepared using the in vitro re-constituting method, as confirmed by FIXa catalyzed FX activating enzymatic assay. The Y-axis indicates the absorbance at 405 nm of the chromogenic substrate assay. All the data were collected in triplicate and are expressed as mean ± SD. Parent and C1-, C3-assembled BsAb were prepared in ART-S3 format by in vitro re-construction in reduced condition using separately expressed monospecific antibodies, followed by desalting using dialysis cassettes. C1 and C3 were prepared in dKiHv14 format from four chain transfected single Expi293F cells, followed by protein A purification. BsAb yields of all antibodies were validated > 95% by CIEX. Data of C1 and C3 was not collected at 1000 nmol/L due to the insufficient concentration of the prepared antibody.
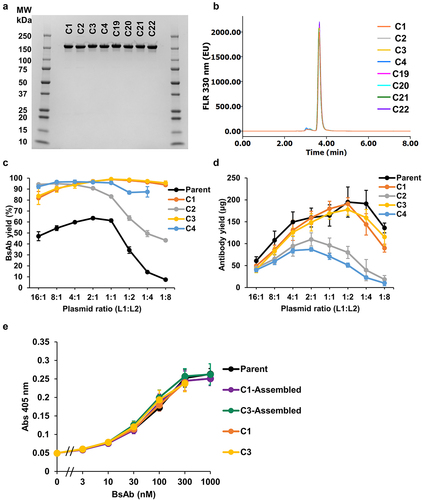
Figure 3. Pharmacokinetic profiles of the selected FAST-Ig variants Comparable pharmacokinetics of NXT007 with different FAST-Ig mutations were confirmed in human FcRn homozyhous transgenic mice strain, B6.Cg-Fcgrttm1Dcr Tg(FCGRT)32Dcr. One mg/kg dose of each BsAb was administered by single intravenous injection via tail vein. Individual data points were collected from three mice in each group and are expressed as mean ± SD.
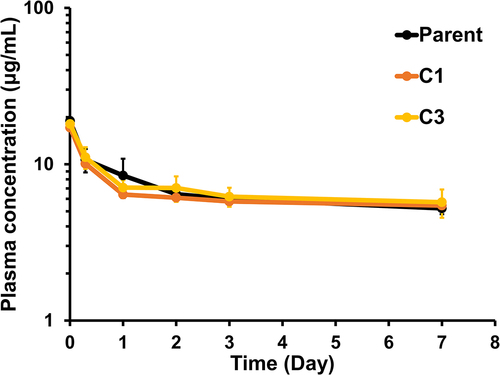
Table 3. AUC parameters of NXT007 with various FAST-Ig mutations and its parent from Day 0 to Day 7 in human FcRn transgenic mice. AUC profiles comparable to that of the parent were observed in tested FAST-Ig variants. A 1 mg/kg dose of each BsAb was administered by single intravenous injection via tail vein. Data were collected from three mice in each group and are expressed as mean ± SD. The BsAb yields of all antibodies used in this study were confirmed >95% by CIEX analysis.
Figure 4. Overall structure of NXT007 Fabs with C3 mutations (a) Structural superposition of the anti-FIXa Fab structure of NXT007 containing CH1_(K147), Q175K, and CL_S131E, T180E mutations (Fab-FIXa-C3: PDB 8GUZ) and the parent anti-FIXa Fab (Fab-FIXa: PDB 8GV0, light green). In the Fab-FIXa-C3, HC and LC are orange and light orange, respectively. The key residues are shown as stick models. (b) Structural superposition of the anti-FX Fab structure of NXT007 containing CH1_K147E, Q175E, and CL_T131K, S180K mutations (Fab-FX-C3: PDB 8GV1) and the parent anti-FX Fab (Fab-FX: PDB 8GV2, light purple). In the Fab-FX-C3, HC and LC are blue and light blue, respectively. The key residues are shown as stick models. (c, d) Close-up views of the charge-pairs of FAST-Ig C3 mutations. (c) The three key interactions in Fab-FIXa-C3 (CH1_K147/CL_S131E, CH1_Q175K/CL_S131E, and CH1_Q175K/T180E) are shown with light blue dashed lines. (d) The three key interactions in Fab-FX-C3 (CH1_K147E/CL_T131K, CH1_Q175E/CL_T131K, and CH1_Q175E/S180K) are shown with light blue dashed lines. Molecular graphic images were prepared using CueMol (http://www.cuemol.org).
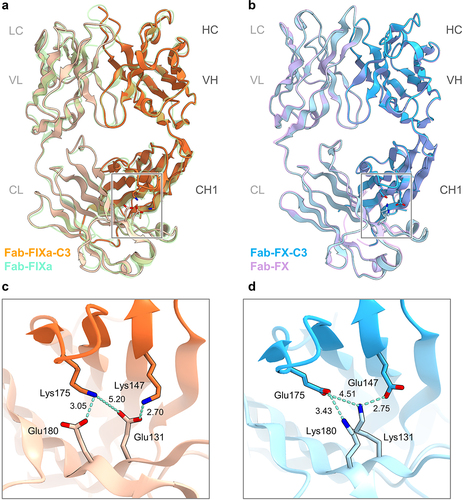
Figure 5. Comparison of stability after low pH exposure and pairing potency between dKiHv14 and ART-S3 (A-C) Acid-induced denature of NXT007 with different Fc mutations, dKiHv14 (a) and ART-S3 (b), was compared by SEC analysis at pH 6.0 (indicated as initial), pH 3.6, and pH 3.2 for 3 hours, followed by neutralization with or without incubation for 24 hours at room temperature (RT). (c) Y axis indicates the extent of denature of antibody as the whole area ratio (arbitrary unit) of ANS fluorescence at 510 nm divided by UV detection at 280 nm. (d) Stability of the human FcRn (hFcrn) binding of NXT007 with dKiHv14 and ART-S3 mutations was compared by SPR analysis. The hFcrn binding ability was calculated as relative binding response (Resonance Unit) per antibody capture amount. Samples were same as in (a-c). (e, f) CIEX chromatography analysis with an optimized CIEX method (pH and NaCl concentration gradient, described in materials and methods) for NXT007 with dKiHv14 (e) or ART-S3 (f). The same chromatograms with reference mispairs are shown in Figure S9. Antibodies were expressed at the optimized plasmid mass ratio H1:L1:H2:L2 = 1.3:2:1:2 in Expi293F and purified by protein A.
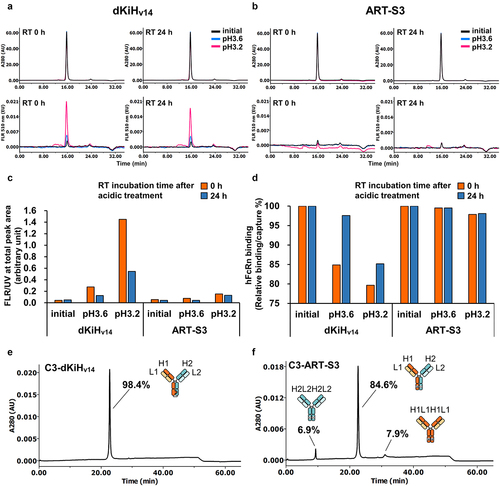
Table 4. Characterization of the stable CHO cell line for production of NXT007. The cell line derived from clone 46 in Figure S13 was characterized. Titer was obtained from the protein A purified NXT007 pool on Day 14, which was 57 days after thawing the master cell bank (MCB). The percentage of the target BsAb (H1L1H2L2), major homodimeric mispairs (H1L1H1L1, H2L2H2L2), and the other mispairs were measured using same CIEX analysis methods described in Figure S9.