Figures & data
Figure 1. (a) Structure of anti-SARS-CoV −2 Fabs bound to a spike RBD. The image was generated using UCSF ChimeraXCitation9,Citation10 by superimposing the structures of REGN10933/REGN10987 (PDB ID: 6×DG), P2B − 2F6 (PDB ID: 7BWJ) and CR3022 (PDB ID: 6W41). The RBD is shown by the green surface, and Fabs in different binding classes are shown as cartoons of different colors. (b) the mutations located at spike protein RBD in Alpha, Beta, Gamma, Delta, and Omicron BA.1 variants are shown. The sequence corresponding to RBM is highlighted in green.
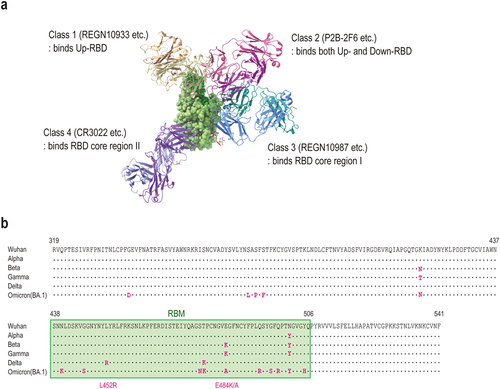
Figure 2. An on-off rate map indicating the binding kinetics parameters of anti-SARS-CoV −2 mAbs against Wuhan spike protein analyzed by SPR analysis. The association rate constant (kon) is plotted against the dissociation rate constant (koff). The diagonal lines indicate the equilibrium dissociation constant (KD).
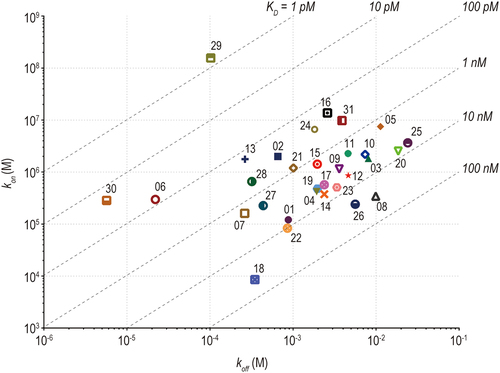
Table 1. mAbs used in this study.
Figure 3. Binding and neutralization activities against spike proteins of SARS-CoV −2 variants. AUCs calculated from the dose–response curves of spike protein binding assay (Supplement ) and neutralization assay (Supplement ) are shown. Spike proteins from the following lineages were used in the assay: Wuhan, Alpha (B.1.1.7), Beta (B.1.351), Gamma (P.1), Delta *1 (B.1.617.2; AY.4), Delta *2 (B.1.617.2; AY.4.2), Delta *3 (B.1.617.2; AY.3; AY.5; AY.6; AY.7; AY.14) and Omicron (B.1.1.529; BA.1).
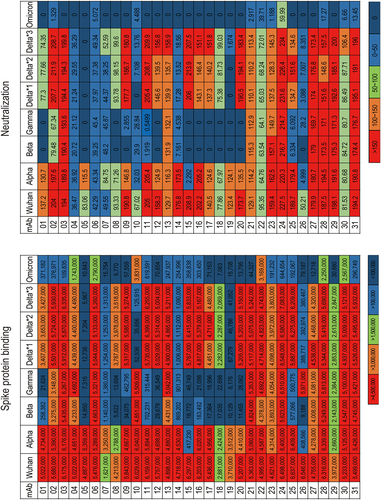
Figure 4. Comparison of the binding activities to spike proteins of SARS-CoV −2 variants among mAbs of different binding classes. The relative binding activities (%) were calculated by normalizing the AUCs of binding to variant spike proteins by those to the Wuhan spike protein. Relative binding (% against Wuhan) to Alpha (B.1.1.7), Beta (B.1.351), Gamma (P.1), Delta *1 (B.1.617.2; AY.4), Delta *2 (B.1.617.2; AY.4.2), Delta *3 (B.1.617.2; AY.3; AY.5; AY.6; AY.7; AY.14) and Omicron (B.1.1.529; BA.1) are shown for each binding class.
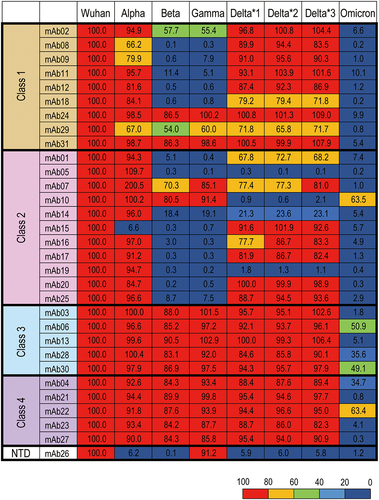
Figure 5. FcγRIIa activation by immune complexes consisting of anti-SARS-CoV −2 mAbs and SARS-CoV −2 pseudo-typed virus. FcγRIIa activation was measured using Jurkat/FcγRIIa/NFAT-Luc reporter cells. Data represent means + SEMs (n = 3).
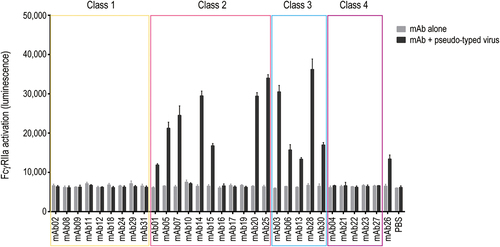
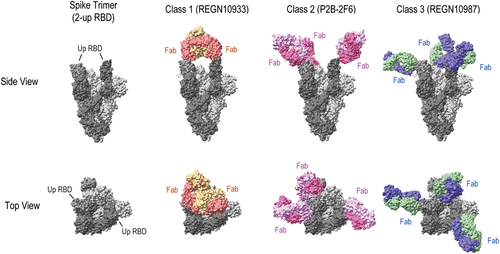
Figure 6. Structural models of anti-SARS-CoV −2 mAb Fab bound to a spike trimer. A spike trimer in two-up conformation (PDB ID: 6 × 2B) is shown as a gray surface (“up” RBDs, dark gray; “down” RBDs, light gray). Binding models of REGN10933 (class 1), P2B − 2F6 (class 2) and REGN10987 (class 3) were generated using UCSF ChimeraX by superimposing structures (REGN10933/REGN10987: 6×DG, P2B − 2F6: 7BWJ). Fab molecules are shown as colored surfaces.