
Figures & data
Figure 1. Schematic of the REGN bsAb format with site-specific substitutions at the Fc domain. The star represents the position of HY to RF substitutions in the three-dimensional structure of REGN bsAbs. EU numbering was used to label antibody sequences.
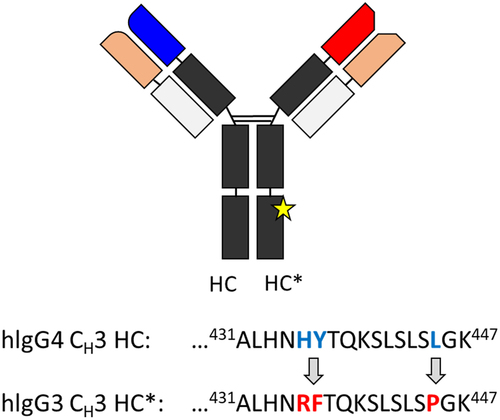
Figure 2. (a) Structural homology of the Fc domain of REGN bsAb-1. Regions showing statistically significant differences in deuterium uptake (HC* > HC) are in red. Regions with unchanged deuterium uptake after substitutions are in gray. Representative HDX-MS kinetic plots are shown for (b) CH peptide 241FLFPPKPKDTLM252, (c) CH peptide 427VMHEALHNHYTQK439 (for HC) and 427VMHEALHNRFTQK439 (for HC*) and (d) CH peptide 298STYRVVSVL306. The means and error bars (standard deviations) are based on triplicated experiments.
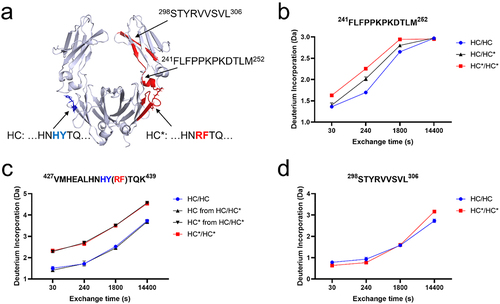
Figure 3. DSC thermograms of Fc subunit of (a) HC/HC homodimer, (b) HC/HC* heterodimer, (c) HC*/HC* homodimer of REGN bsAb-1 in 150 mM ammonium acetate, pH 6.0. Black trace represents the experimental data. The blue dotted traces represent the thermal transition fits and the red trace represents the cumulative fit data.
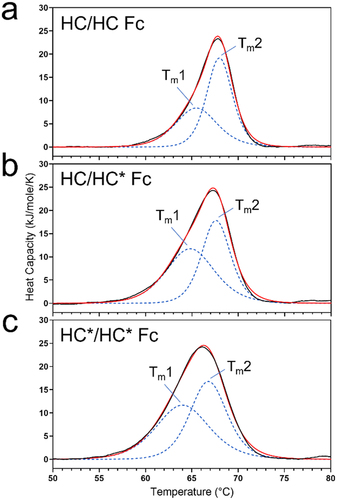
Table 1. Thermal stability of Fc subunit samples indicated by the melting onset temperature (Tonset) and the melting transitions (Tm and Tm) as measured by DSC. The mean and standard deviations (SD) are based on triplicate measurements.
Figure 4. Quantification of (a) HC Met252/HC* Met252 and (b) HC Met428/HC* Met428 oxidation under H2O2 stress; (c) HC Met252/HC* Met252 and (d) HC Met428/HC* Met428 oxidation under thermal stress in bsAb-1 heterodimer and homodimers. The levels of Met oxidation generated in stressed samples at different time points were normalized by subtracting the initial Met oxidation level for the same Met residue in each sample prior to incubation. The means and error bars (standard deviations) are based on triplicated experiments.
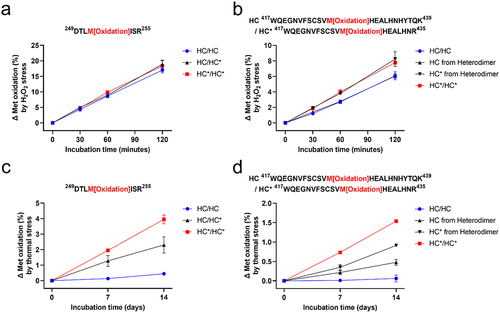
Figure 5. (a) Significant differences in deuterium uptake for the CH peptide 241FLFPPKPKDTLM252 between mAb 1–3 and bsAb 2–4. (b) Normalized oxidation level of HC Met252/HC* Met252 in thermal stressed samples. (c) Deuterium uptake of the CH peptide 427VMHEALHNHYTQK439 with or without HY to RF substitutions. (d) Normalized oxidation level of HC Met252/HC* Met252 in thermal stressed samples. The means and error bars (standard deviations) are based on triplicated experiments. Statistical testing was demonstrated in Figure S7.
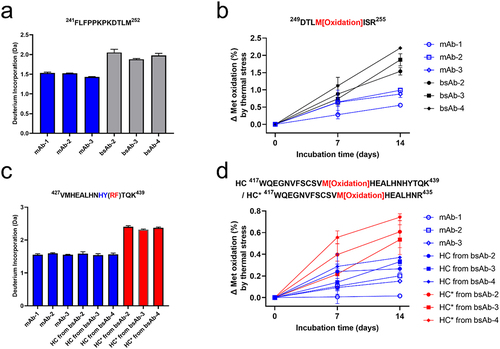
Figure 6. BLI sensorgrams of FcRn binding to Fc subunit of (a) HC/HC homodimer, (b) HC/HC* heterodimer, (c) HC*/HC* homodimer of bsAb-1.
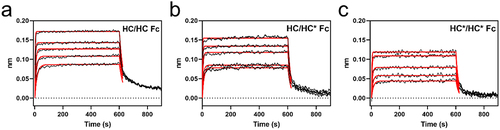
Table 2. Steady state analysis of the bindings between human FcRn and REGN bsAb-1 Fc subunit samples.