Figures & data
Figure 1. Schematic diagram of the eight T-bsAb formats tested in the current study.
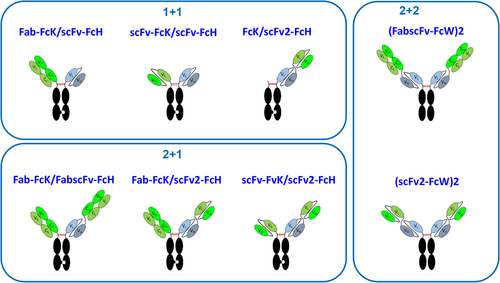
Figure 2. Schematic diagram of the RMCE process and targeting vector design.
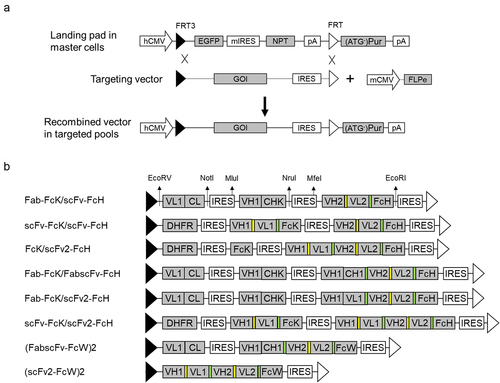
Figure 3. Comparison of titer, IVCD and qP of eight different HER2×CD3 T-bsAbs produced in CHO cells.
Figure 4. AKTA profile during CEX purification and SEC profile of eight different HER2×CD3 T-bsAbs after an initial protein a step.
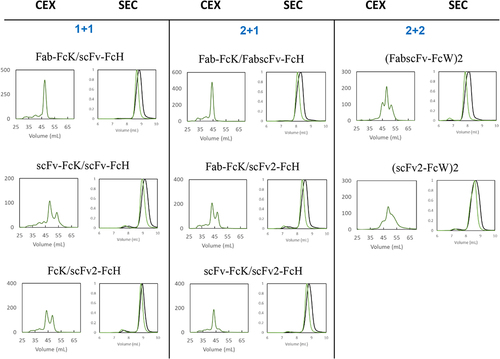
Table 1. Aggregation profile of T-bsAbs of different formats post Protein a and post CEX.
Table 2. Effect of different format on Thermal Melting Temperatures (Tm1, Tm2, Tm3, and Tm4) of Trastuzumab and bispecific antibodies as measured by DSC. The Tm value indicated the midpoint temperature of the thermal unfolding transition of antibody.
Table 3. Binding affinity of different antibody formats to CD3E/D and Her2 via Octet and cell-based assays.
Figure 5. Flow cytometric analysis of antigen binding capacities of eight different HER2×CD3 T-bsAbs.
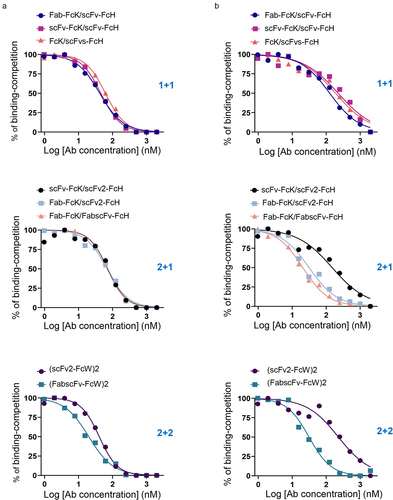
Figure 6. T cell activation upon stimulation of various HER2×CD3 T-bsAbs in the presence of tumor cells.
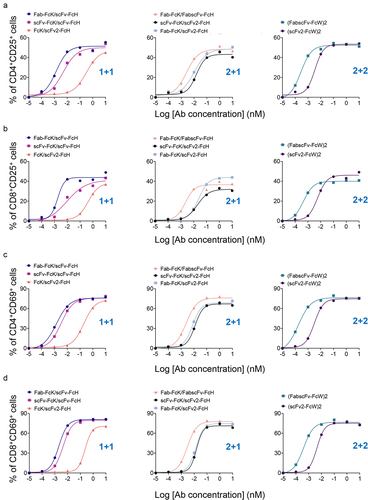
Table 4. Summary of results for cell-based functional characterization assays.
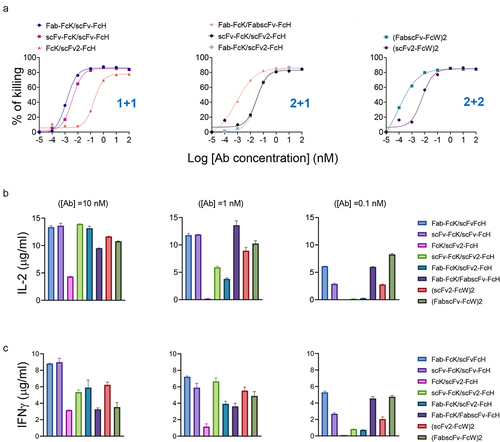
Figure 7. Tumor cell-killing and cytokine production by T cells induced by eight different HER2×CD3 T-bsAbs.