
Figures & data
Figure 1. Pharmacokinetic profile of ACI-5891 variants in wildtype mice and NHPs. (a) ACI-5891 (mouse IgG2a) free plasma concentration (y-axis) over time (x-axis) in CD-1 mice after IV injection at 30 mg/kg. Data are depicted as the mean ± standard deviation for 3–4 animals/group. (b) Total serum concentration (y-axis) of human chimeric IgG1 ACI-5891.5 (solid circles) and humanized ACI-5891.1 (solid squares) over time (x-axis) in NHPs after IV bolus injection at 40 mg/kg. Data are depicted as the mean ± standard deviation for 3 animals/group.
Table 1. Properties of ACI-5891 humanized variants.
Table 2. Population PK parameter estimates following single IV administration at 40 mg/kg in NHPs.
Figure 2. Investigation of factors contributing to fast clearance of ACI-5891.1. (a) Human FcRn (hFcRn) binding of ACI-5891.1 at pH 6.0 (left panel) and pH 7.4 (right panel). SPR measurement performed using antibody concentrations of 3000 nM, 1000 nM, 333.3 nM, 111.0 nM, and 37.0 nM as depicted. Sensorgrams are shown in black lines. (b) Non-specific binding of ACI-5891.1 and ACI-5891.5 by heparin and insulin ELISA. Mean signals for both targets are reported as nonspecific binding score. (c) Surface representation of ACI-5891.1 Fv model colored according to Eisenberg’s scale of hydrophobicity (shown at the bottom of panel c). Intense red indicates the most hydrophobic residue while white represents the most hydrophilic residue.
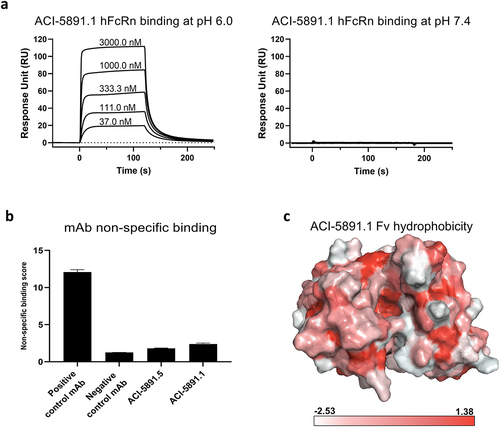
Table 3. Affinity of ACI-5891 variants to mouse, human and NHP FcRn.
Table 4. Distribution of major glycoforms in ACI-5891.1 and ACI-5891.5.
Figure 3. Electrostatic surface representation of ACI-5891.5 Fv and selection of human framework (a) Electrostatic surface representation of ACI-5891.5 Fv model. Representation identical to the murine ACI-5891 Fv model. Key framework amino acids contributing to positive charges are indicated with white arrows. Positive charges are displayed in blue, negative charges in red, and neutral patches in white. Black box indicates light chain residue. (b) List of human VH and VL germlines with at least 50% sequence identity with original mouse sequences. Tables depict the calculated pI, the net charge at pH 5.5 and the sequence identity with the parental mouse antibody ACI-5891. Original germlines used for humanization of ACI-5891.1 are framed in blue and germlines selected for their lower charge are framed in red.
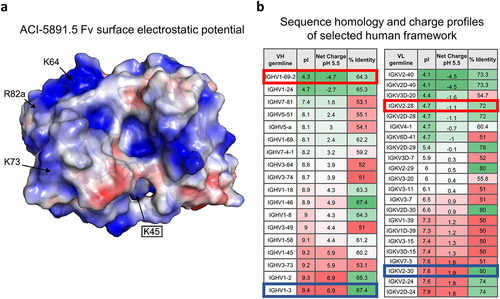
Figure 4. Electrostatic surface representation of ACI-5891 humanized variants. Front, top, and back view of ACI-5891 chimera (ACI-5891.5), and the variants: ACI-5891.1 and ACI-5891.9, humanized using IGHV1–3/IGKV2–30 and IGHV1-69-2/IGKV2–28, respectively. Positive charges are displayed in blue, negative charges in red, and neutral patches in white. Black boxes indicate light chain residue.
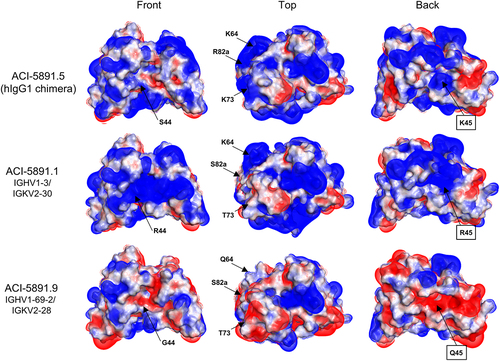
Figure 5. Binding kinetics of ACI-5891 variants determined by SPR. Affinity determination of ACI-5891 variants to TDP-43 by SPR in single cycle kinetics at concentration ranging from 1.2 nM to 100 nM. Analysis was performed using a 1:1 binding model. Gray line depicts the experimental data and black line depicts the data fit to the model.
Figure 6. Single-dose pharmacokinetics in Tg32 mice and NHPs. (a) Total antibody serum concentration (y-axis) of ACI-5891.5, ACI-5891.1 and ACI-5891.9 over time (x-axis) in Tg32 mice after IV bolus injection at 40 mg/kg. Data are depicted as the mean ± standard deviation for 3 animals/time point, for a total of 21 animals per group. Empty symbols represent data point for which at least one serum concentration was below the limit of quantification. (b) Total antibody serum concentration (y-axis) of ACI-5891.5, ACI-5891.1 and ACI-5891.9 over time (x-axis) in NHPs after IV bolus injection at 40 mg/kg. Data are depicted as the mean ± standard deviation for 3–4 animals/group. Lower limit of quantification (LLOQ) indicated in dotted line for both graphs.
Table 5. Population PK parameters estimates following single IV administration at 40 mg/kg in Tg32 mice.