Figures & data
Figure 1. Overall synthetic scheme for a monoclonal antibody comprising various α1,3-galactosylated glycans in the Fc region. MBD-α1–3-GalTase: Maltose-binding domain-conjugated α1–3-galactosyltransferase; UDP-Gal: uridine diphosphate galactose.
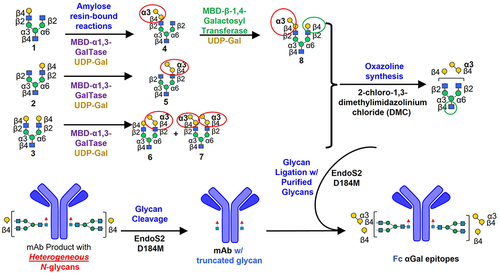
Figure 2. Synthesis of α1–3-Gal-containing mono-β-galactosylated (G1T) Glycans. (a, b) Mono-β-galactosylated glycans (1) and (2) were reacted with α1–3 galactosyltransferase (MBD-α1–3-GalTase) to produce mono-α/β-galactosylated glycans (4) and (5). Overlaid HPAEC-PAD chromatograms show the starting materials and products. (c) HPAEC-PAD traces showing the purified α1–3-Gal-containing glycans (4 and 5) following purification by Hypercarb PGC-HPLC. (d, e) Mono-α-galactosylated (4) and (5) were partially degraded by α1–3,6-galactosidase (black traces) to produce compounds (1) and (2). As a negative control, starting materials were also reacted with β-1,4-galactosidase (red traces), which showed no reactions as expected.
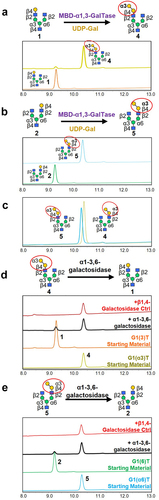
Figure 3. Synthesis of α1–3-Gal-containing bi-β-galactosylated (G2T) glycans. (a) Synthetic scheme for reaction of bi-β-galactosylated glycan (3) with α1–3-GalTase to produce mono- and bi-α-galactosylated glycans (6-8). Overlaid (b) HPAEC-PAD and (C) PGC-HPLC chromatographs show the starting material (blue trace), and partial reactions at 37°C after 2 and 8 h leading to the formation of α-galactosylated glycans (6-8). PGC-HPLC chromatographs show the presence of β- and α-anomers for each glycan. (d, e) Treatment of purified mono-α-galactosylated glycan (d) (6) and (e) (8) with α1–3,6 galactosidase (black traces) confirms the presence of an α1–3-Gal epitope. (f, g) Reaction of mono-α-galactosylated glycans (f) (6) and (g) (8) with LacZ β1–4-galactosidase (red traces) results in the formation of compounds (5) and (4), respectively. The characteristic re-arrangement byproduct of the LacZ β1–4 galactosidase reaction is denoted by an asterisk. As a reference, G1(α3)T (4) and G1(α6)T (5) glycans synthesized independently (i.e., from Figure 2a, b) are shown. (h) Synthesis of mono-α-galactosylated glycan (8) using mono-α/β-galactosylated glycan (4), UDP-Gal and β1–4-galactosyltransferase. HPAEC-PAD trace of the final product is shown. (i) Bi-α-galactosylated (7) was partially cleaved with α1–3,6-galactosidase to produce compounds (3, 6, and 8, black trace). As a negative control, glycan (7) was also reacted with LacZ β-1,4-galactosidase, which showed no reactions (red trace).
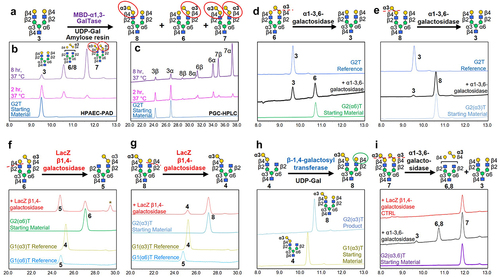
Figure 4. Characterization of palivizumab transglycosylated with α1–3-Gal-containing Fc N-glycans. (a, b) SDS-PAGE gels of palivizumab transglycosylated with (a) conventional human-type glycans and (b) non-human α-galactosylated glycans, and the deglycosylated starting material (S.M.). Lanes with both product and starting materials are shown to confirm differences in band migration. A protein ladder is shown on the first lane of each gel. (c, d) Analysis of transglycosylated glycans, which were cleaved from the palivizumab protein backbone with PNGase F, and analyzed by (c) HPAEC-PAD, and (d) CE-LIF following APTS Labelling. Glycans cleaved from commercial palivizumab is shown as a reference.
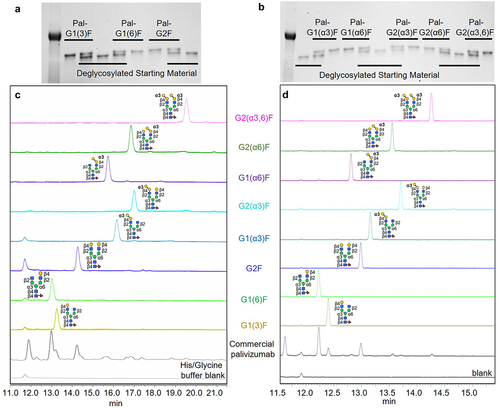
Figure 5. Homogeneous bi-α-galactosylated glycoforms in the Fc region binds to different commercially available anti-α1,3-Gal IgE antibodies by ELISA. Binding to (a) clone 16D9 and (b) clone 10H8 anti-α1,3-Gal IgE antibodies. Bi-α-galactosylated glycans (purple diamond data points) bind relatively higher than mono-α-galactosylated Fc glycans. Commercially available cetuximab containing 27–34% Fab bi-α-galactosylated glycans are shown as a comparison. Commercially available palivizumab (Synagis) and deglycosylated palivizumab are shown as negative controls (gray data points). Error bars represent mean ± standard deviation from three separate experiments.
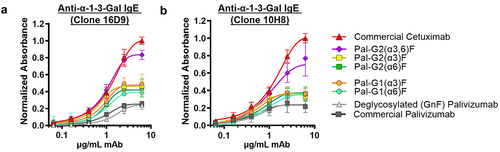
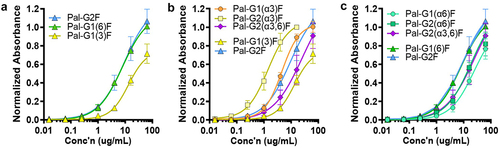
Figure 6. α1–3- or β1–4-galactosylation on each α3 or α6 antenna differentially affects FcγRIIIA binding. (a) Absence of β1–4-galactosylation (Gal-β1–4-GlcNAc) on the α6 antenna decreases binding (G1(3)F, yellow triangle) compared to its presence (G1(6)F and G2F, green and blue triangles, respectively). (b) α1–3-galactosylation (addition of α1–3-Gal epitope) on the α3 antenna increases FcγRIIIA binding (orange circles) compared to parental G1(3)F (yellow triangles), with additional β-galactosylation of the α6 antenna further increasing binding (yellow squares). However, addition of second α1–3-Gal epitope on the α6 antenna decreases binding (purple diamonds). (c) α1–3-galactosylation on the α6 antenna decreases binding regardless of substitution at the α3 antenna (cyan circles vs green squares vs purple diamonds) compared to parental G1(6)F and G2F (green and blue triangles, respectively). Error bars represent mean ± standard deviation from three separate experiments.