Figures & data
Figure 1. Heavy chain transgene engineering approaches to eliminate splice variants (a) a pictorial representation of the exon/intron arrangement in the HC expression cassette, the intron between the hinge and CH2 domain is highlighted as particularly susceptible to mis-splicing, SP = signal peptide (b) Depiction of the different HCCD intron arrangements generated in a single plasmid encoding both the HC and LC for mAb-B, the different HCCD formats were cDNA sequence optimized (cDNA-opt), gDNA non-sequence-optimized (gDNA) and gDNA sequence optimized with three mutations in the CH2 to lower the score of in silico predicted cryptic splice acceptors, illustrated by the red stars (gDNA-opt-mut). Plasmids were used to generate stable CHO pools which were subject to a fed-batch process, n = 3 pools for each construct, graph shows mean+SD. Terminal fed-batch titers represented as fold change compared to the cDNA sequence optimized plasmid, statistics analysis was performed using an unpaired t-test, *= P < 0.05, **= P < 0.005, ***=P < 0.005, ****=P < 0.0005. (c) Molecular mechanism of the variant transcript produced by mis-splicing using a cryptic acceptor site resulting in deletion of the first 54 nucleotides of the CH2 domain. (d) Molecular mechanism of the hinge-less splice variant transcript. Both variant transcripts resulted in in-frame shifts in coding sequence, * = Stop codon. (E) Non-reduced and reduced western blot analysis of mAb-B HC (top panels) and LC (lower panels) from transient expression supernatants, sampled at day 5 post transfection; mAb-1 to 5 are the five expression constructs in , present as positive controls, hinge-less mAb 1 and 2 are two transfection replicates of the same plasmid.
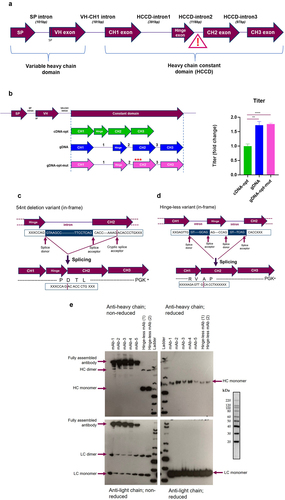
Table 1. Heavy chain transgene engineering summary.
Figure 2. Removal of individual introns in the HCCD does not affect titer. (a) Depiction of the different HCCD intron arrangements generated in a plasmid expressing mAb-B showing systematic removal of individual introns. Expression plasmids were evaluated using a stable CHO pool fed-batch process (b) Terminal fed-batch titers represented as fold change compared to gDNA (c) Average viable cell number (VCN) (x106/mL) (d) Cell viability (%) (e) Integral of viable cells (IVC) (109 cell hr/L) (f) Cell productivity (qP) (pg/(cell day)) represented as fold change compared to gDNA. All graphs show the mean ± SD, n = 3 in all cases, statistical analysis was performed using an unpaired t-test, ns= not significant, *= P < 0.05, **= P < 0.005.
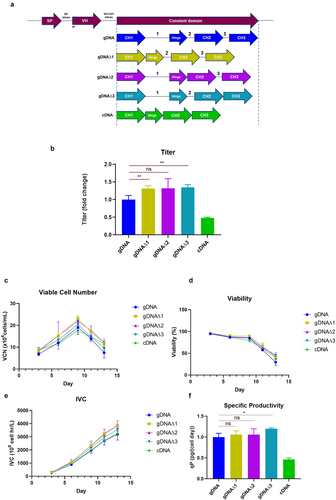
Figure 3. The VH-CH1 intron is inhibitory to titer unless HCCD-Intron1 is present (a) Depiction of the different HCCD intron arrangements generated in a plasmid expressing mAb-B. Expression plasmids were evaluated using a stable CHO pool fed-batch process. (b) Terminal fed-batch titers represented as fold change compared to gDNA∆2. (c) Depiction of the different HCCD intron arrangements generated in plasmids expressing mAb-B. Expression plasmids were evaluated using a stable CHO pool fed-batch process (d) Terminal fed-batch titers represented as fold change compared to gDNA. The graphs show the mean + SD, n = 3 in all cases, statistics determined using an unpaired t-test, **= P < 0.005, ns=not significant.
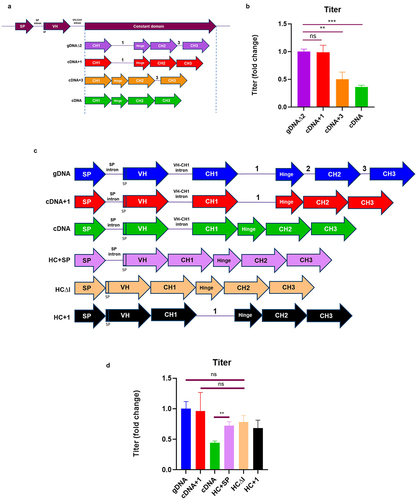
Figure 4. VH-CH1 intron is retained in the absence of HCCD-intron1 (a) Depiction of the different HCCD intron arrangements evaluated in plasmids expressing four different mAbs; mAb-A, mAb-B, mAb-C and mAb-D. Stable CHO pool were generated and evaluated using a fed-batch process. (b) Terminal fed-batch titers represented as fold change compared to gDNA for each molecule. The graphs show the mean + SD, n = 3 in all cases, statistical analysis was performed using an unpaired t-test, **= P < 0.005, ***=P < 0.005, ****=P < 0.0005, ns=not significant. Intron retention data from (c) is summarized beneath each construct tested, + = high level intron retention detection, - = little/no intron retention detected. (c) Evaluation of cDNA in a PCR based VH-CH1 intron retention assay using primers designed to anneal to each unique IgG variable HC and a common reverse primer in the CH1 constant region. PCR products were resolved and visualized on a 1% agarose gel. Molecular marker is Bioline HyperLadder 1kb. Table describes expected band sizes for spliced or unspliced species.
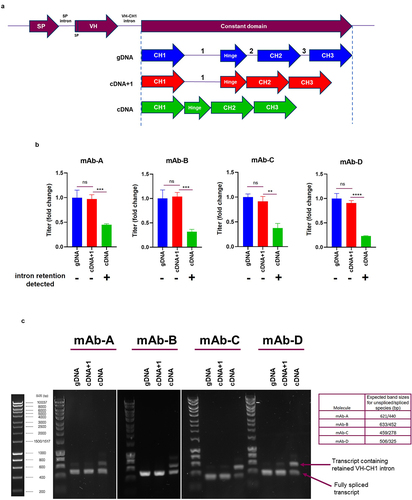
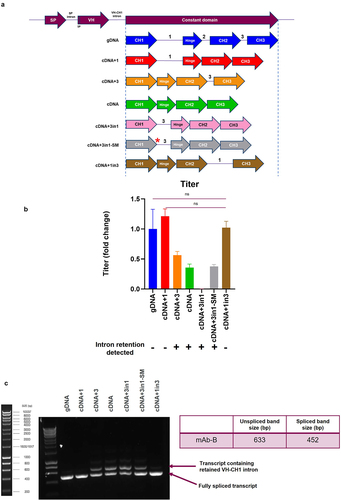
Figure 5. HCCD-intron1 can alleviate VH-CH1 intron retention when moved within the HCCD (A) Depiction of the different HC intron arrangements used in plasmids expressing mAb-B. Expression plasmids were evaluated using a stable CHO pool fed-batch process. SM= sequence modified by 1-nucleotide to increase splice donor strength (b) Fed-batch titers represented as fold change compared to gDNA. The mean + SD is shown, n = 3 in all cases, statistical analysis was determined using an unpaired t-test, ns=not significant. Intron retention data from (c) is summarized beneath each construct tested, + = high level intron retention detection, - = little/no intron retention detected. (c) Evaluation of the expression plasmids in a VH-CH1 intron retention assay. Total RNA was extracted from the CHO pool cells, followed by cDNA synthesis. PCR was carried out with primers designed to anneal to each unique variable HC and a common reverse primer in the constant region. PCR products were resolved and visualized on a 1% agarose gel. Molecular marker is Bioline HyperLadder 1kb. Table describes expected band sizes for spliced or unspliced species.