Figures & data
© 2023 Affimed GmbH. Published with license by Taylor&Francis Group, LLC
Figure 1. FcRn-Ph-HPLC is capable of reliably assessing the FcRn dissociation pH of mAbs, which can be correlated with half-life established in vivo in humans.
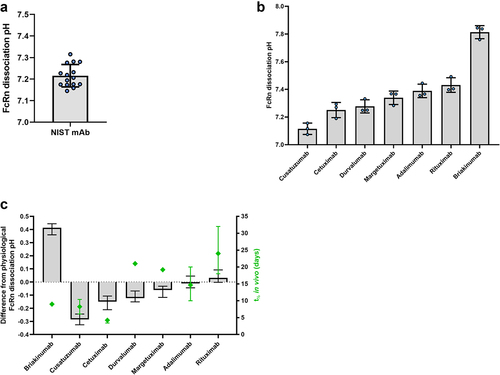
Figure 2. Examples of common Fc domain mutations used in the engineering of therapeutic IgGs do not significantly influence FcRn dissociation pH.
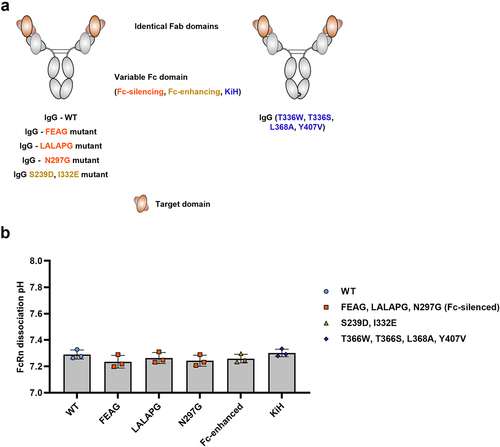
Figure 3. Incorporating different antigen-binding domain sequences to a common antigen significantly influences the FcRn dissociation pH.
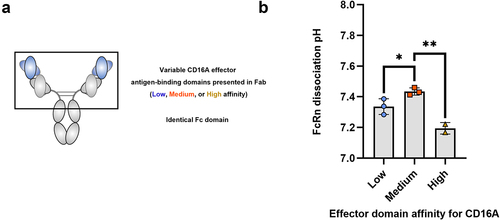
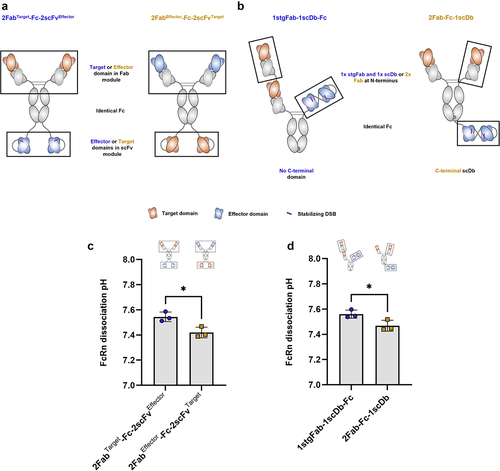
Figure 4. The number of antigen-binding domains presented in scFv or scDb significantly influences FcRn dissociation pH.
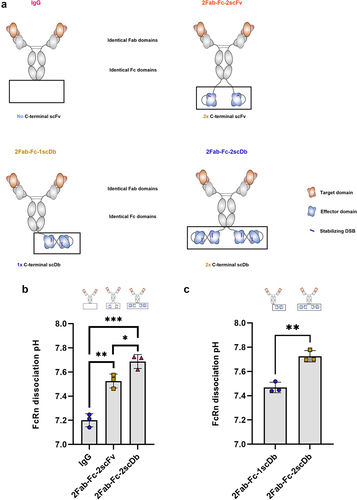
Figure 5. Incorporation of different target domain sequences specific to different antigens within N-terminal Fab modules in bsAbs influences FcRn dissociation pH.
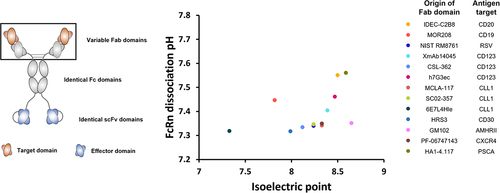
Figure 6. Incorporation of stabilizing DSB within scFv modules of bsAb does not significantly influence FcRn dissociation pH.
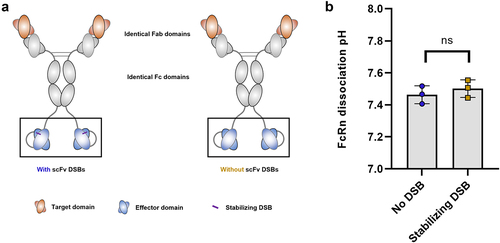
Figure 7. The structure in which antigen-binding domains are presented significantly influences FcRn dissociation pH.
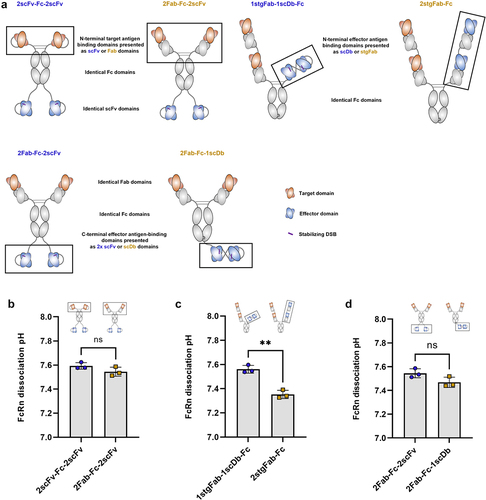
Figure 8. The orientation of antigen-binding domains within a bsAb significantly influences FcRn dissociation pH.