Figures & data
Table 1. Sequence of the ePG-1 polypeptide containing an N-terminal methionine (M) from the bacterial expression vector and a C-terminal linker-His-tag for purification purposes.
Figure 1. SPR binding studies of the CA-IX mAbs and F(Ab)s to immobilized ePG-1 polypeptide. SPR sensorgrams of (a) mAb M75 and mAb 2D7, (b) mAb 11H9 and its F(Ab) fragment, and (c) mAb 12H8 and its F(Ab) fragment to the immobilized ePG-1 polypeptide. MAb 2D7, which binds to CA-IX’s catalytic domainCitation15, and mAb M75, which binds CA-IX’s PG domainCitation8 were used as a negative and positive control, respectively. MAbs were flowed at 1.23, 3.7, 11.1, and 33.3 nM whereas F(Ab)s were flowed at 1.23, 3.7, 11.1, 33.3 and 100 nM over the chip surface with immobilized ePG-1.
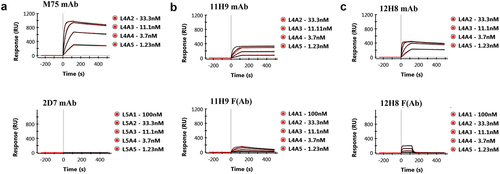
Table 2. Phenomenological kinetic values obtained by fitting a 1:1 binding model to the SPR data for the 11H9, 12H8, and M75 anti-CA-IX mAbs and the F(Ab)s of 11H9 and 12H8 to the ePG-1 and ePG-2 polypeptides.
Figure 2. Solution conformation of ePG-1 characterized by NMR using backbone 3JHN,HA coupling constants, 15N{Citation1H} heteronuclear NOE measurements and detailed resonance assignments. (a) essentially uniform 3JHN,HA coupling constants (of 6–7 Hz) indicate largely random coil conformations for the ePG-1 backbone. (b) Small 15N{Citation1H} heteronuclear NOE values with excursions to negative values are also characteristic of unfolded polypeptide chains for ePG-1. NMR data for the central region of ePG-1 could not be analyzed due to overlaps of the 1H/Citation15N-HSQC signals of the highly repetitive sequence PPGEEDLPGEEDLPGEEDLP. The companion 15N longitudinal (T1) and transverse (T2) relaxation data are shown in SupplFig. S3B and SupplFig. S3C, respectively. (c) assigned HSQC spectrum of ePG-1. The amino acid sequence of ePG-1 () is reproduced here with Pro (P37 of the hCA-IX sequence) as the first residue for the NMR assignment numbering. The italicized black font indicates the locations of the 11 Gly residues in the sequence of ePG-1. The inset details some signal assignments of the heavily overlapping region in the HSQC spectrum. A rectangular box outlines the side-chain amide HSQC signals of Asn and Gln residues. Two Gln residues, Q2 and Q8, and two Asn residues, N91 and N92 are located at the N-terminal and C-terminal regions of ePG-1, respectively.
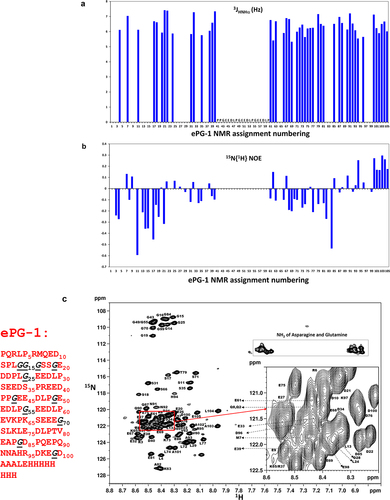
Figure 3. (a) 1H/Citation15N-HSQC spectrum of ePG-1 responding to 12H8-F(Ab) binding with assignments of ePG-1 signals that perturbed and disappeared (shown in black) in the 1:1 complex. The inset shows the detailed responses of the 11 Gly signals with the disappearance of the signals of G14 and G16 of free ePG-1 (black) along with the appearance of two new HSQC signals for the complex (red). Signal movements in response to 12H8 binding were assigned tentatively as indicated by arrows in the inset, producing the chemical shift perturbations for G14, G15 and Gl6 in decreasing amplitudes. (b) Gly region of ePG-1 HSQC responding to 11H9-F(Ab) binding; the left-most panels show the superposition of the complex spectra with that of free ePG-1 (black) exemplifying the response of G25 while the right panels detailing Gly signal intensity evolutions from free ePG-1 (black) to the 1:1 (red), 1:2 (blue) and 1:5 (green) complexes, respectively. (c) Ser region of the ePG-1 HSQC spectrum responding to excess 11H9-F(Ab) binding, i.e., From 1:1 (red) to 1:2 (blue) and to 1:5 (green) for the ePG-1/F(Ab) ratio, respectively; free ePG-1 spectra are shown in black.
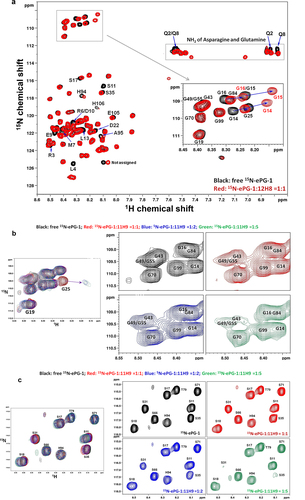
Figure 4. Amide 1H/Citation15N-TROSY NMR spectrum of 13C/Citation15N/Citation2H-labeled ePG-1 in a 1:1 stoichiometric complex with the 11H9-F(Ab) fragment. Well-dispersed signals are labeled with the respective residue assignments in the triple-labeled ePG-1. It should be noted that the remaining signals in the rest of this TROSY spectrum are similar in chemical shift positions to the 1H/Citation15N-HSQC spectra of free ePG-1 (see ).
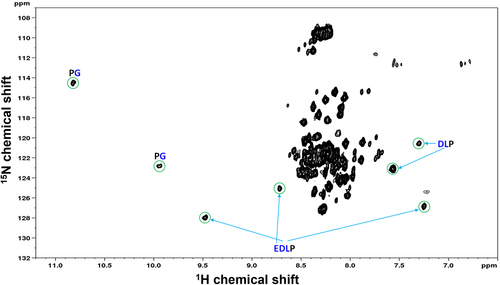
Figure 5. Epitope mapping by yeast surface display strategy. (a) Cartoon depicting the CA-IX N-terminal fragments that were expressed on the cell surface of yeast. (b) ELISA results showing the yeast-displayed CA-IX fragments binding to mAb 11H9 (red), 12H8 (blue) and M75 (gray).
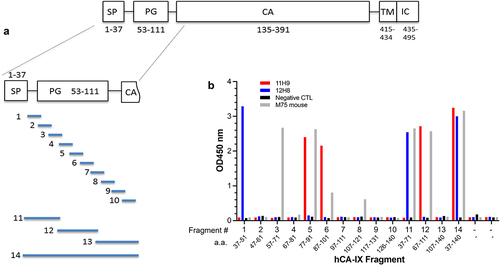
Figure 6. Fine epitope mapping using yeast surface display (YSD). (a) Summary of antibody binding of yeast-displayed 15-residue tiling fragments of the CA-IX N-terminal region, residues 37–140. The colored sequences (12H8, green; 11H9, red, M75, blue) are the fragments within CA-IX IDR that showed the highest binding to each of the indicated antibodies by yeast cell ELISA (see ). (b) Fine epitope mapping on 15-residue fragments that were identified to bind the antibodies through N-and C-terminal truncations to determine the “minimal” epitope followed by mutagenic alanine scan. Residues in large font and bold are those that do not tolerate alanine substitution indicating their critical role in antibody binding (see text for details).
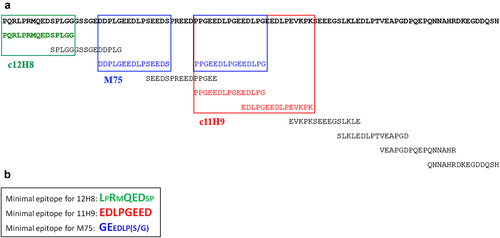
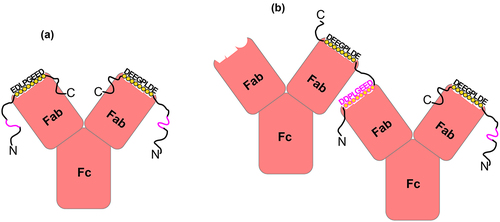
Figure 7. A schematic representation of the unique interactions of the 11H9 mAb with the ePG-1 polypeptide containing two epitopes. (a) the 2:1 (PG:11H9) complex is formed preferentially when the two combining sites of 11H9 are occupied by the high-affinity epitope EDLPGEED (shown in black circles), especially when the concentration of ePG-1 is higher than or equal to the 2:1 stoichiometry. With a concentration of ePG-1 at the 1:1 (PG:11H9) ratio, the same 2:1 (PG:11H9) complex is formed for 25% of the 11H9 concentration while 50% of 11H9 forms a 1:1 (PG:11H9) complex via the high-affinity epitope. The fraction of unoccupied 11H9 (25%) interacts with the low-affinity secondary epitope, e.g. DDPLGEED, exposed in the 2:1 (PG:11H9) complex (shown in pink), leading to differential HSQC signal perturbations of residues around this site (SupplFig. S4). Such a 2:1 (PG:11H9) complex can also be formed on SPR sensor chips with the ePG-1 polypeptide immobilized via its His-tag binding to surface-conjugated anti-His antibodies (see Materials and Methods), leading to the extremely slow rate of dissociation of 11H9 mAb from the sensor chip surface ( and SupplFig. S1B), (a) with a concentration of ePG-1 lower than the 2:1 stoichiometry, the insufficient spacing provided by ~ 22 residues between the high-affinity and low-affinity epitopes in ePG-1 favors intermolecular cross-linking or aggregation of the 1:1 PG:11H9 species, as evidenced by turbidity and precipitation in ePG-1/11H9 samples prepared at ~ 2:1 and ~ 1:1 ratios for the concentrations of ePG-1 and 11H9, respectively (see SupplFig. S4 for further details). The 2:1 (PG:11H9) complex species shown in (A) is also present in these (2:1 and 1:1) samples as detected by both 1H/Citation15N-HSQC (SupplFig. S4C/D/E/F) and by size-exclusion chromatography (SupplFig. S5) after removing the cross-linked and insoluble 11H9 aggregates by centrifugation.