
Figures & data
Figure 1. Design of recombinantly produced antibodies.
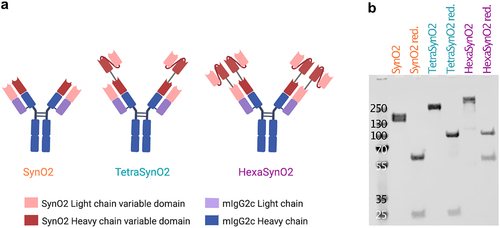
Figure 2. Thermal stability of SynO2, TetraSynO2 and HexaSynO2 measured by Tycho.
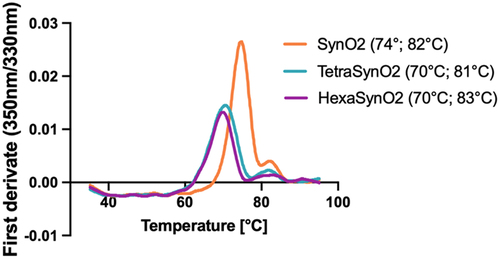
Figure 3. Characterization of SynO2Fab.

Figure 4. Sandwich Aβ ELISA detects cross-reactivity of SynO2 and HexaSynO2 with Aβ aggregates.
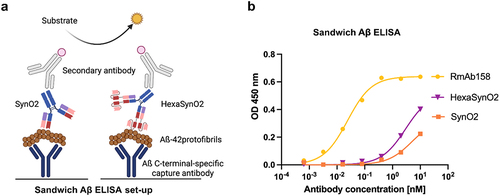
Figure 5. Inhibition ELISA illustrating the binding strength of SynO2 and HexaSynO2 to αSyn monomers, HNE aggregates and αSyn fibrils.
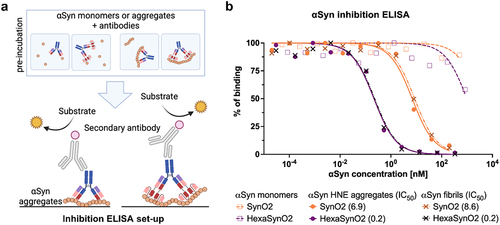
Figure 6. Kinetic evaluation of interactions of SynO2Fab, SynO2, TetraSynO2 and HexaSynO2 with αSyn HNE aggregates recorded by LigandTracer.
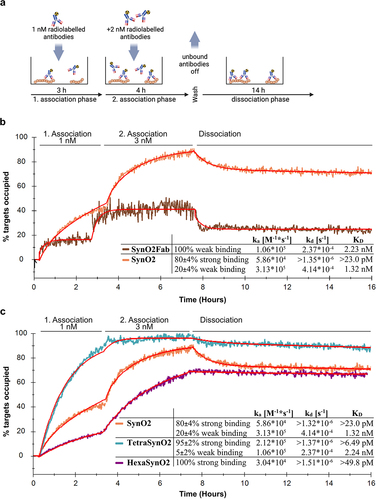
Table 1. Start values for kinetic evaluations of interactions between antibodies and αSyn HNE aggregates recorded by LigandTracer. All interaction curves were individually fit with start values set at (1) global scope or (2) constant scope as indicated below, respectively.