
Figures & data
Table 1. Data collected on the antibody panel.
Figure 1. Pairwise Spearman correlations for a selected set of in vitro assays. See table S3 for the complete set of pairwise correlations.
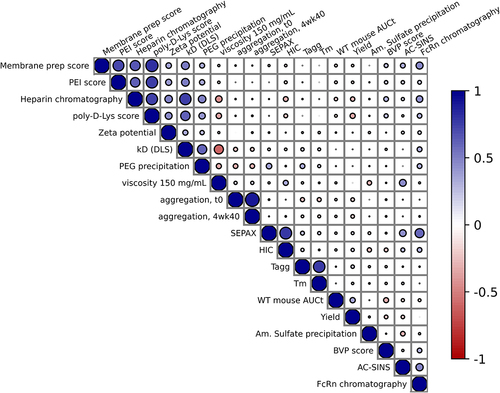
Figure 2. Homology modeling pipeline accuracy measured across all 23 experimental crystal structures.
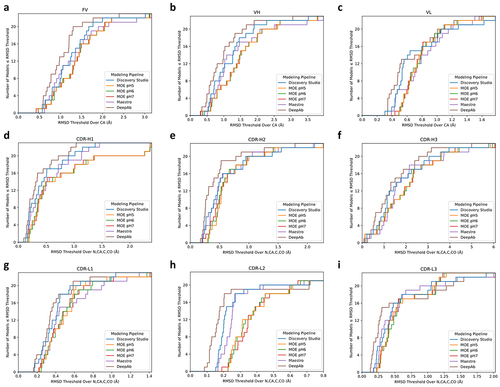
Figure 3. Deamidation (a) and isomerization (b) rates for each indicated motif. Fractions indicate the # of sites with >/ = 2% modification after 4 weeks at 40°C over total number of CDR sites with coverage in the peptide mapping data.
Table 2. Spearman rank correlations of the top features in each category that achieve correlations with measured viscosity of magnitude . Structure-based feature names are as defined by the MOE software package. All p-values are
.
Table 3. Median test metrics of viscosity binary classifiers. One hundred random stratified train-test splits were performed for various feature combinations. Median test metrics of logistic regression models trained with an elastic net regularization penalty applied are reported. HT = high throughput experimental features (AC-SINS, DLS, and PEG precipitation). Structure = 112 structure-based features derived from structural models. AUC = area under the receiver-operator curve. MCC = Matthews correlation coefficient. PLR = positive likelihood ratio (true positive rate/false positive rate). The confusion matrix for the best model (HT + Structure) is as follows: true positives = 40. True negatives = 23. False positives = 5. False negatives = 3. Here, ‘positive’ refers to a molecule with low viscosity (<15 cP @ 150 mg/ml).
Table 4. Spearman rank correlations of the top features in each category that achieve correlations with measured PK AUCt of magnitude . Structure-based feature names are as defined by the MOE software package. All p values are
.
Table 5. Median test metrics of PK clearance binary classifiers. One hundred random stratified train-test splits were performed for various feature combinations. Median test metrics of logistic regression models trained with an elastic net regularization penalty applied are reported. Experimental = (heparin chromatography, DLS, zeta potential, ammonium sulfate precipitation, PEG precipitation, BVP, membrane Prep assay, poly-D-Lysine assay, PEI assay, HIC, DSF, SEPAX, and AC-SINS). Structure = 112 structure-based features derived from structural models. AUC = area under the receiver-operator curve. MCC = Matthews correlation coefficient. PLR = positive likelihood ratio (true positive rate/false positive rate). The confusion matrix for the best model (structure) is as follows: true positives = 3. True negatives = 49. False positives = 1. False negatives = 2. Here, ‘positive’ refers to a molecule with high clearance ( 3.9 × 10Citation6 h x ng/mL).