
Figures & data
Figure 1. Characterization of trontinemab plaque binding. (a) image of trontinemab’s molecular format. Green = anti-TfR1 cross-Fab; gray = Fc component of IgG1; blue = Fab arms of IgG1; red = glycan. (b) rate constant maps showing the binding kinetics of gantenerumab (left) and trontinemab (right) binding to immobilized Aβ peptide. Darker areas represent higher binding of the mAbs to the immobilized Aβ peptide. Biacore SPR assay interaction maps were generated utilizing the Ridgeview Tracedrawer software for . (c) rate constant maps showing the kinetics of trontinemab binding to human TfR1 (left) and cynomolgus TfR1 (right) at 25°C, Biacore SPR assay. Darker areas represent higher binding of the trontinemab to the TfR1 species. (d) gantenerumab (left) and trontinemab (right) binding to human AD brain sections. Red represents the presence of the respective mAb. Staining of the mAbs was conducted by incubation with a secondary antibody (goat anti-human IgG(H+L)/AlexaFluor555, MolecularProbes, A21433) followed by nuclei staining (DAPI, 1 μg/mL in PBS), with intermediary wash buffer rinsing. (e) plot showing the induction of induced protein 10 (IP-10) release from activated U937 monocytes by gantenerumab (red squares) and trontinemab (blue circles). Aβ, amyloid-beta; DAPI, 4′,6-diamidino-2-phenylindole; ELISA, enzyme-linked immunosorbent assay; IgG, immunoglobulin G; ka, on-rate; kd, off-rate; KD, equilibrium dissociation constant; PBS, phosphate buffer saline; mAb, monoclonal antibody; TfR1, transferrin receptor 1.
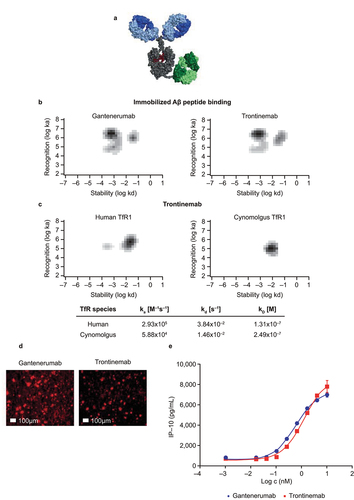
Figure 2. Observed plasma concentrations overlaid on pharmacokinetic model prediction distributions. Observed plasma concentrations (dots) after single IV administration of trontinemab (left, 10 mg/kg) and gantenerumab (right, 20 mg/kg) overlaid on pharmacokinetic model prediction distributions shown as median (lines) and 90% prediction intervals (shaded areas). Plasma concentrations were sampled at 0.083, 0.25, 0.5, 1, 2, 4, 8, 24, 31, 48, 72, 96, 168, and 240 h post-dose. For trontinemab, accelerated clearance is observed at late time points, presumably caused by ADAs and with negligible impact on total exposure (four observations for the 336-hour time point with median concentration of 69 ng/mL lie outside of the plot range). ADA, anti-drug antibodies; h, hour; IV, intravenous.
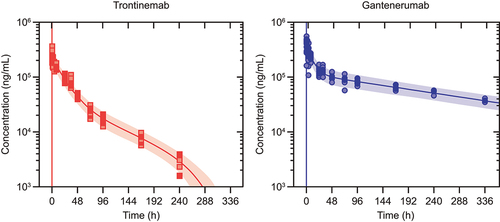
Table 1. Estimated PK parameters for trontinemab and gantenerumab in NHPs.
Figure 3. Observed brain concentration of gantenerumab (blue circles) and trontinemab (red squares) overlaid with model simulations (lines) in NHPs. Plots showing concentration of the mAb in the hippocampus, cerebellum, choroid plexus, cortex, striatum, and cerebrospinal fluid up to 336 h post-dose. For graphical representation, observed concentrations were corrected for the contribution of residual plasma using the naïve approach, leading to some concentrations being displayed with negative values. Kp ratio, AUC gain, and Cmax gain were not assessed for the choroid plexus. AUC, area under the curve; Cmax, maximum concentration; Kp, brain distribution coefficient; h, hour; NHP, non-human primate.
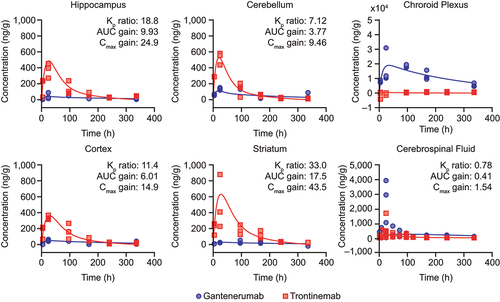
Figure 4. Triplex immunofluorescence of cynomolgus cortex brain sections 24 hours after a single IV injection of trontinemab (top) or gantenerumab (bottom). Immunofluorescent images showing the localization of microglia (IBA1, red), therapeutic antibody (anti-idiotypic) (yellow), vascular basement membrane (collagen IV, green) and nuclei (DAPI, blue) staining in brain sections 24 hours after trontinemab or gantenerumab dosing. At 24 hours post-dose, gantenerumab is limited to vasculature (co-localization with collagen IV), whereas trontinemab is present in the parenchyma (IBA1 co-localization) in addition to vasculature. Immunostaining was performed using the Ventana Discovery Ultra automated stainer. DAPI, 4′,6-diamidino-2-phenylindole; IBA1, ionized calcium-binding adaptor protein.
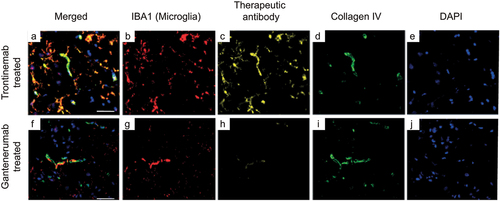
Figure 5. Model-based comparison of amyloid load reduction (PET SUVR) in the cortex following dosing with a cumulative dose of 600 mg gantenerumab every 4 weeks (300 mg IV of gantenerumab every 2 weeks, blue line) or with 210 mg of trontinemab every 4 weeks (red line and shaded confidence bands). Plots showing simulated SUVR reduction over time with an inset plot showing the dynamics for the first 6 weeks. For gantenerumab, simulations with the original plasma-exposure-driven model (dashed green line) overlay closely with the transformed brain-exposure-driven model (blue line). For the selected dosing regimen, similar amyloid reduction was predicted for trontinemab and gantenerumab over 1 year. Translational uncertainty (shown as 90% [lighter red] and 50% [darker red] confidence bands shaded in red) is illustrated assuming a 90% probability that the true typical values of the plasma clearance and the brain distribution coefficient are within two-fold of the predicted values based on log-normal distributions. Inset shows the dynamics for the first 6 weeks. IV, intravenous; PET, positron emission tomography; SUVR, standardized uptake value ratio.
![Figure 5. Model-based comparison of amyloid load reduction (PET SUVR) in the cortex following dosing with a cumulative dose of 600 mg gantenerumab every 4 weeks (300 mg IV of gantenerumab every 2 weeks, blue line) or with 210 mg of trontinemab every 4 weeks (red line and shaded confidence bands). Plots showing simulated SUVR reduction over time with an inset plot showing the dynamics for the first 6 weeks. For gantenerumab, simulations with the original plasma-exposure-driven model (dashed green line) overlay closely with the transformed brain-exposure-driven model (blue line). For the selected dosing regimen, similar amyloid reduction was predicted for trontinemab and gantenerumab over 1 year. Translational uncertainty (shown as 90% [lighter red] and 50% [darker red] confidence bands shaded in red) is illustrated assuming a 90% probability that the true typical values of the plasma clearance and the brain distribution coefficient are within two-fold of the predicted values based on log-normal distributions. Inset shows the dynamics for the first 6 weeks. IV, intravenous; PET, positron emission tomography; SUVR, standardized uptake value ratio.](/cms/asset/bf9b4785-c8b5-490a-8c9d-cda983b080d8/kmab_a_2261509_f0005_oc.jpg)