Figures & data
Figure 1. Length distribution of human immunoglobulin heavy and light chain CDRs. a) CDRH1. 80,1% of the sequences fall under a CDRH1 length of 8 amino acids (7779 out of 9684 sequences). 14,7% of the sequences have 10 amino acid long CDRH1 (1442 out of 9684 sequences). b) CDRκ1. CDR1 lengths for κ are either 6, 7, 11, or 12 amino acids, interestingly with no lengths of 8 to 10 amino acids, while the frequency 6 (56,4%) and 7 amino acids (25,9%) is highest c) CDRλ1. CDRλ1 lengths for λ are either 6, 7, 8, or 9 amino acids long, while all are comparably frequent (6 amino acids highest with 35,6%), 7 amino acids is rarely used (5,8%). d) CDRH2. 62,9% of the sequences have an 8 amino acids long CDRH2, constituting the majority of the CDRH2 diversity (6088 out of 9684 sequences). A considerable number of sequences have 7 amino acids long CDRH2 (28,9%, 2795 out of 9684 sequences). e) CDRκ2. CDR2 for κ is exclusively 3 amino acids long (99,8%) f) CDRλ2. CDR2 for λ seems to be limited to 3 amino acids (92,4%) with a rare occurrence of 7 amino acids. g) CDRκ3. CDR3 for κ shows lower diversity that its counterpart in heavy chain with only four lengths and where 9 amino acids comprises the majority of sequences (69,9%) h) CDRH3. The length diversity of CDRH3 is much greater than those of CDRH1 and CDRH2. There are 18 lengths with more than 50 sequences, where 14 and 15 amino acids are the two most abundant lengths. Human heavy chain CDRH3 can be remarkably long up to 36 (only 1 sequence entry in database). i) CDRλ3. CDR3 for λ also shows low diversity compared to CDRH3 with four lengths spanning the CDR3 length diversity and where 11 amino acids comprises the majority of sequences (46,8%).
Figure 2. Average of relative abundance of each amino acid per CDR of heavy (a) and light chain (b), globular (Glob) and transmembrane proteins (TMB). The frequencies of globular proteins, transmembrane proteins, framework regions within human antibody sequences, and constant regions taking Trastuzumab as model IgG are shown for comparison a) the average relative abundances of the 20 natural amino acids are shown for CDRH1 of 8 amino acids long, CDRH2 of 7 and 8 amino acids long, all CDRH3 lengths with more than 50 sequences in the database. B) average distribution of amino acids in κ and λ CDRs. The average relative abundances of the 20 natural amino acids are shown for the most abundant κ and λ light chain lengths for CDR1, CDR2, and CDR3.
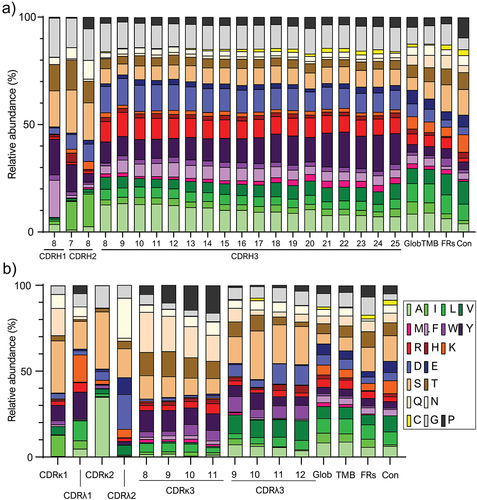
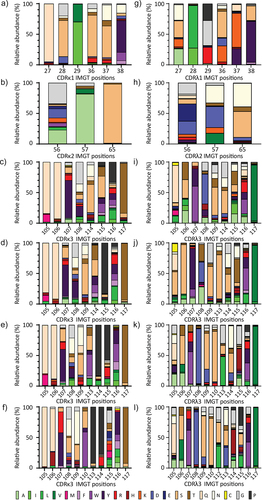
Figure 3. Amino acid distributions per position in CDRH1, CDRH2, and CDRH3. The y-axis shows relative abundance in percentage (%) and the x-axis shows the specific position within each CDRH for plots a to G. The x-axis in plot H and I shows the different CDRH3 lengths studied. a) CDRH1 b) CDRH2-7aa c) CDRH2-8aa d) CDRH3-8aa e) CDRH3-14aa f) CDRH3-20aa g) CDRH3-25aa h) amino acid changes over different CDRH3 length at flanking CDRH3 IMGT positions i) amino acid changes over different CDRH3 length at inner CDRH3 IMGT positions.
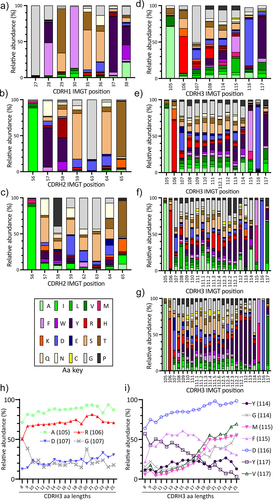
Figure 4. Position specific amino acid distribution in κ and λ light chain CDRs. The y-axis shows the relative abundance of each amino acid while the x-axis shows the positions for CDR1, CDR2, and CDR3 according to IMGT numbering scheme. a) CDRκ1-6aa b) CDRκ2 c) CDRκ3-8aa d) CDRκ3-9aa e) CDRκ3-10aa f) CDRκ3-11aa g) CDRλ1-6aa h) CDRλ2 i) CDRλ2-9aa j) CDRλ2-10aa k) CDRλ2-11aa i) CDRλ2-12aa.