Figures & data
Figure 1. Sequence conservation of drug targets. a) Human drug targets show high conservation with mouse orthologs. A collection of 663 small and large molecule human drug targets curated in the ECOdrug database7 were analyzed with respect to their sequence identity in mice. 48% of targets showed sequence identity of >90%, and 24% of targets showed sequence identity of >95% compared to their mouse orthologs. Seven targets were not predicted to have a murine ortholog. b) Phylogenetic tree of divergent species used as hosts for immunization, shown with respect to evolutionary distance from humans.8,9
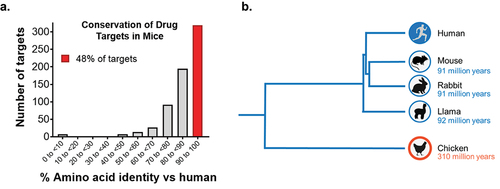
Figure 2. Technologies enabling MAbs from divergent species. a) The development of antibody discovery technologies that provide an alternative to hybridomas have enabled the discovery and approval of therapeutic MAbs from divergent species, including camelid, rabbit, and chicken. b) Increasing use of divergent species for therapeutic MAb discovery and development. Analysis of the TABS therapeutic antibody database23 between 2005 and 2020 demonstrates the growing pipeline of MAbs from divergent species in clinical and preclinical development.
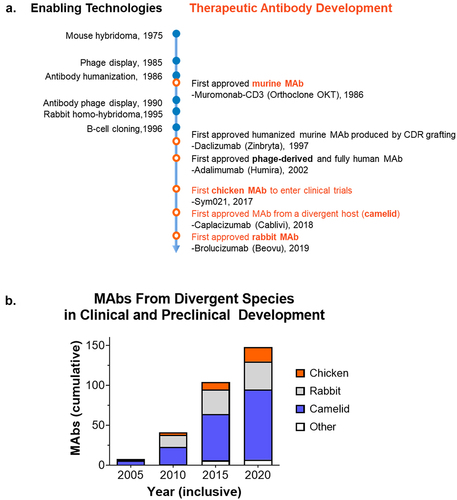
Table 1. MAb discovery challenges addressed by using divergent hosts.
Figure 3. HCDR3 length and paratope shape. Antibodies co-crystalized with target proteins corroborate the influence of HCDR3 length with paratope shape. In these examples, MAbs with smaller HCDR3 regions have concave (4 amino acid) and flat (11 amino acid) paratopes (left and middle panels). However, erenumab (right panel) with an HCDR3 length of 21 amino acids forms a protruding convex paratope that reaches into a pocket of the CGRP receptor. Structures were obtained from the Protein Data Bank (nivolumab 5WT9, cetuximab 5SX5, and erenumab 6UMG). Cetuximab was derived from mouse immunization, while nivolumab and erenumab were derived from transgenic mice that produce human MAbs.
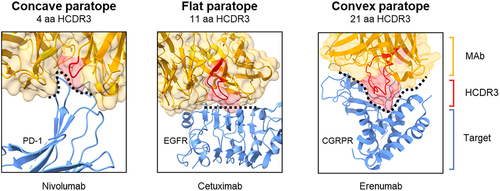
Figure 4. Few currently marketed therapeutic antibodies have long HCDR3. We analyzed the HCDR3 sequences of 137 FDA approved and late clinical stage MAbs.5 The average HCDR3 length of these MAbs was 10 amino acids. Only 16% of these MAbs have an HCDR3 length of 14 amino acids or more, the predicted threshold to form a protruding topology. The relationship between HCDR3 length and paratope shape noted here is based on the study by Ramsland et al.32
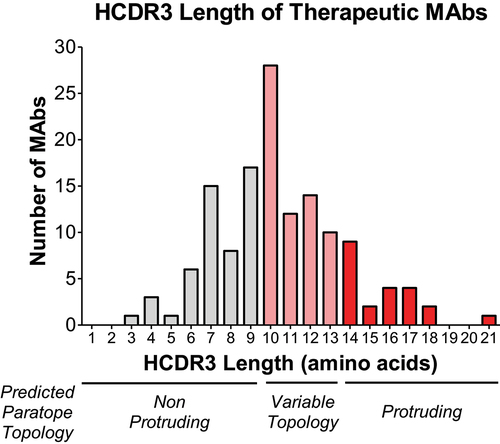
Table 2. MAbs raised in divergent species frequently show cross-reactivity in rodents and other animals frequently used in preclinical studies.
Table 3. Comparative features and advantages of therapeutic MAbs generated in different animals.
Figure 5. Human drug targets are less conserved in chickens compared with mice. A collection of 663 human drug targets curated in the ECOdrug databaseCitation7 were analyzed with respect to their amino sequence homology. Almost half (48%) of the human drug targets have the highest degree of conservation (>90%) when compared with mice, but only 15% of targets are conserved at this high level with chickens.
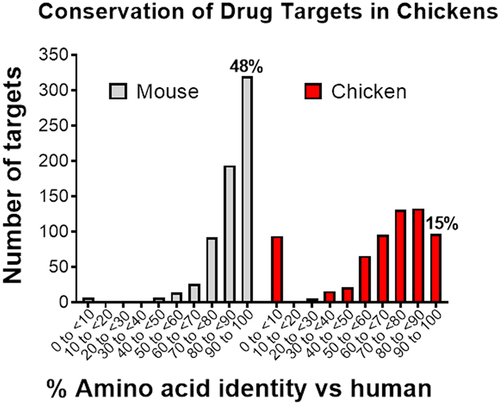
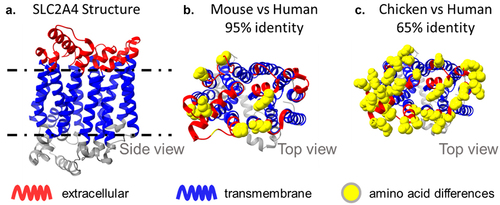
Figure 6. Sequence divergence of SLC2A4, a conserved 12-TM transporter. SLC2A4 is a complex immunogen with small extracellular loops and 95% sequence identity between mouse and human. The extracellular loops of human SLC2A4 have only 9 amino acid differences relative to mouse, but 20 amino acid differences (and only 65% identity) with the closest chicken paralog, SLC2A1. The use of a chicken host enabled the discovery of antibodies with diverse epitopes.11