
Figures & data
Table 1. Amino acid sequence of non-citrullinated and citrullinated peptides.
Table 2. CIT-013’s affinity for non-citrullinated and citrullinated N-terminal histone peptides.
Figure 1. Elevated CIT-013 epitope in RA synovial tissue with moderate to marked active synovitis.
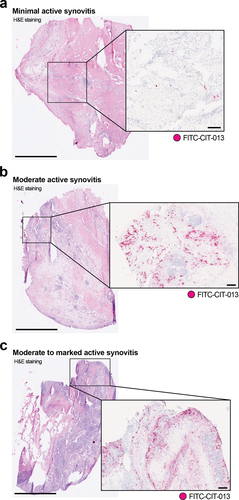
Table 3. Histological severity grade of RA synovia and incidence of CIT-013 staining.
Figure 2. CIT-013 does not bind blood cells and does not affect neutrophil anti-microbial activity other than NETosis.
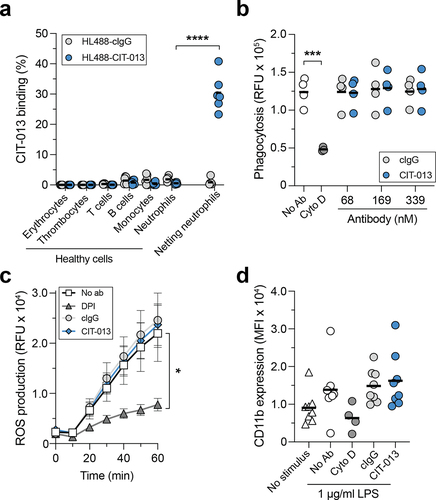
Figure 3. CIT-013 specifically inhibits the release of citrullination rich NETs.
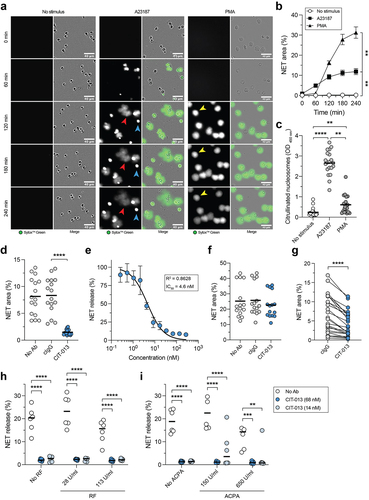
Figure 4. Bivalency is necessary for the NET-inhibitory capacity of CIT-013.
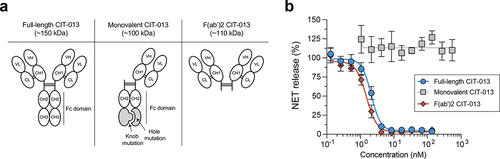
Figure 5. CIT-013 blocks chromatin release from netting neutrophils.
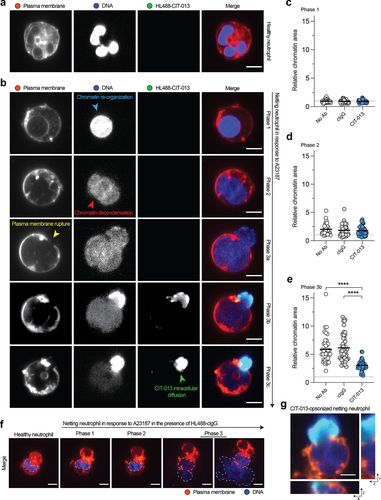
Figure 6. Phagocytosis of CIT-013-opsonized NETs and netting neutrophils by macrophages.
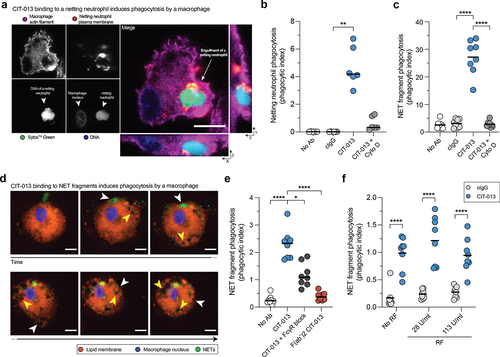
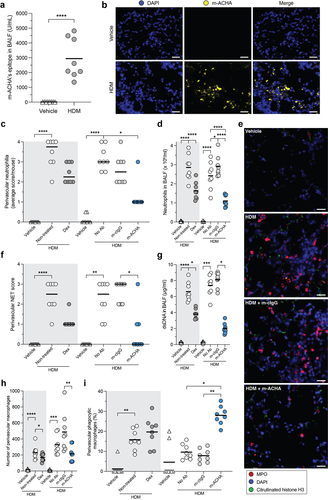
Figure 7. Reduced inflammatory infiltrate and enhanced phagocytosis induced by m-ACHA in a neutrophilic airway inflammation mouse model.
Supplemental Material
Download Zip (34.2 MB)Data availability statement
All data are available under a material transfer agreement with Citryll B.V.