
Figures & data
Figure 1. Representative concentration-response curves in the BMP signaling reporter gene assay of ginisortamab against human gremlin-1, mouse gremlin-1, and Ab7326 mIgG1 against mouse gremlin-1. Ginisortamab can inhibit both (a) human and (b) mouse gremlin-1 in a concentration-dependent manner with mean IC50 values (n = 5) of 8.2 nM and 9 nM, respectively. Ab7326 mIgG1 also inhibits mouse gremlin-1 (c) in a dose-dependent manner with mean IC50 values (n = 5) of 18.5 nM, which is comparable to ginisortamab against human and mouse gremlin-1 in this assay system with the concentrations of ligands used within the detection limits of the assay.
Table 1. Ginisortamab IC50 for the inhibition of gremlin-1 antagonism of BMP-4/7 heterodimer activity, as measured in the BMP signaling reporter gene assay.
Table 2. Affinity of ginisortamab binding human and mouse gremlin-1, as demonstrated by SPR analysis.
Table 3. Affinity of Ab7326 mIgG1 binding mouse gremlin-1, as demonstrated by SPR analysis.
Figure 2. Interaction of Ab7326 Fab with gremlin-1. (a) cartoon representation of the gremlin-1/Ab7326 Fab complex (PDB code 8B7H). Gremlin-1 dimer (cyan and dark blue) with finger and wrist regions labeled (F1, F2, W). One copy of Ab7326 Fab (heavy chain: orange; light chain: yellow) binds each monomer of the gremlin-1 dimer. (b) close-up of the paratope-epitope interactions with the CDR loops of the heavy and light chains color coded and labeled (HCDR1: magenta; HCDR2: light purple; HCDR3: green; LCDR1: red; LCDR2: brown; LCDR3: wheat). (c) key residues involved in the interactions of HCDR3 loop with gremlin-1 are shown in sticks and labeled. The dotted lines indicate hydrogen bonds.
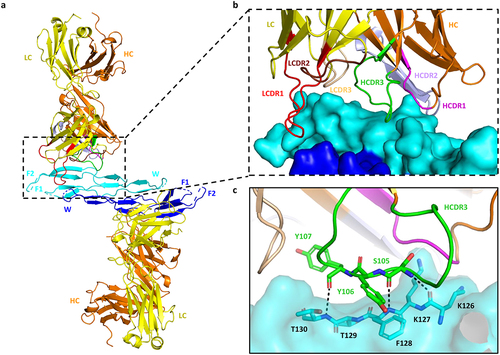
Figure 3. Ab7326 sterically blocks gremlin-1 ligand interaction. (a) surface rendered image of the gremlin-1 dimer (cyan and dark blue) from the gremlin-1/Ab7326 Fab structure (Fabs removed for clarity) with the Ab7326 (red) and GDF5 (green) epitopes highlighted. Close-up shows epitope residues for Ab7326 (red) and key epitope residues for GDF5 (greenCitation29 in sticks and labeled. (b) gremlin-1 dimer (cyan and dark blue, surface rendered) with GDF5 dimer (green cartoon, modeled using the gremlin-2–GDF5 structure 5HK5Citation29) Ab7326 Fab (orange: heavy chain and yellow: light chain, surface rendered) bound. Close-up shows clash of modeled GDF5 with Ab7326 Fab.
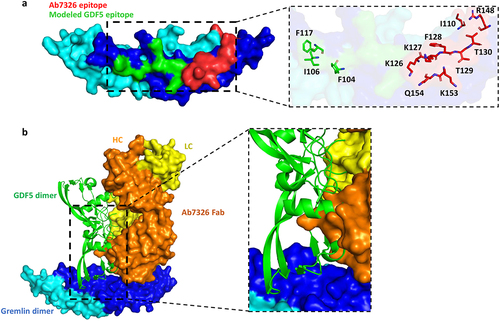
Figure 4. Ginisortamab inhibits gremlin-1 antagonism of BMP signaling pathways in human CRC cell lines. (a) CRC cell lines HCT 116, DLD-1, and LS174T show decreased pSMAD 1/8 in the presence of recombinant human gremlin-1, which can be inhibited by ginisortamab. Gremlin-1 (15 nM) and ginisortamab or hIgG4 control (150 nM) were pre-incubated together for 30 min before adding to CRC cells for 16 h before pSMAD 1/8 analysis by phospho-flow cytometry. Graph shows mean and individual data points of normalized % pSMAD 1/8 signal from n = 2/3 independent experiments. (b) Ginisortamab can reverse recombinant human gremlin-1 suppression of pSMAD 1/8 in HCT 116 CRC cells. HCT 116 were incubated with 15 nM gremlin-1 for 16 h before addition of 150 nM ginisortamab for 30 to 120 min. Graph shows mean and individual data points of normalized % pSMAD 1/8 signal from n = 3 independent experiments. (c) Ginisortamab exhibits dose-dependent reversal of pSMAD 1/8 inhibition. HCT 116 cells were incubated with 15 nM gremlin-1 for 16 h before addition of a titration of ginisortamab for the final 120 min before pSMAD 1/8 analysis. Graph shows individual data points of normalized % pSMAD 1/8 signal from n = 3 independent experiments and non-linear fit curve; IC50 for ginisortamab = 1.578 nM. (d) quantitative RT-PCR analysis of ID1 mRNA level in CRC cell lines stimulated with gremlin-1 in the presence of hIgG4 or ginisortamab. Fold changes are shown relative to hIgG4. Graph shows mean and individual data points from n = 3 independent experiments.
Figure 5. Ginisortamab inhibits endogenous gremlin-1-mediated antagonism of BMP target gene expression in human CRC cells and fibroblasts. (a) Representative immunofluorescence images of CellTracker Deep red-labeled and CellTracker green CMFDA-labeled HCT 116 cells cultured alone or in direct co-culture. Cultures were imaged 72 h after seeding. Representative flow cytometry dot plots showing the gating strategy to isolate CellTracker green CMFDA-labeled CRC cells and CellTrace violet-labeled fibroblasts from co-cultures. TO-PRO3 was added to discriminate between viable and dead cells. (b) quantitative RT-PCR analysis of ID1 mRNA level in CRC cell lines and fibroblasts cultured on their own or in direct co-culture in presence of 150 nM hIgG4 or ginisortamab. CRC cell lines and fibroblast co-cultures were incubated for 72 h and sorted prior to mRNA analysis to isolate pure populations of CRC cell lines (sorted CRC cells) and fibroblasts (sorted ‘Fbs). Fold changes in CRC cell lines and fibroblasts are shown relative to either CRC cell lines or fibroblasts alone treated with hIgG4, respectively. The left y-axes depict gene expression change in CRC cells, and the right y-axes depict gene expression change in fibroblasts. Graphs show mean and individual data points from n = 3 independent experiments.
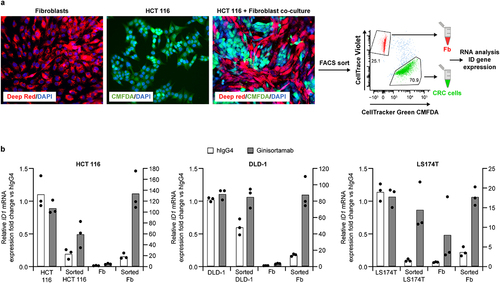
Table 4. Data collection and refinement statistics of X-ray data used for gremlin-1/Ab7326 Fab complex (PDB code: 8B7H).
Table 5. Taqman probe ID list.