
Figures & data
Figure 1. Antibody architecture of bispecific NKp30 × EGFR NKCEs. Structural models of the molecule formats tested in functional assays for their killing capacities of EGFR-expressing cell lines by engagement of human NK cells. NKp30 binding VHH sdAbs (orange) were either used to generate asymmetric bispecific SEEDbody or symmetric bispecific IgG-based NKCEs all harboring one or two humanized Fab entities of cetuximab (hu225, cyan). The impact of monovalent (mv) vs. bivalent (bv) engagement was investigated for NKp30 in combination with mv EGFR (upper left) as well as bv EGFR (lower left) targeting with the depicted VHH-mvhu225_SEEDbody and HC-VHH-C-term-bvhu225 molecules (left panel). To investigate the impact of VHH location in bivalent NKp30- and EGFR-engaging molecules, the IgG-based NKCEs in the right panel were compared. Molecule schemes were generated using PyMol software version 2.3.0.
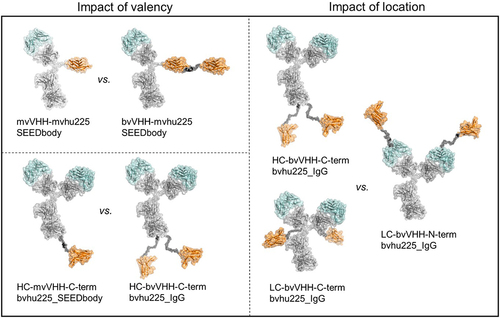
Table 1. Biochemical and biophysical properties of bispecific NKCEs.
Figure 2. Tumor cell lysis of bivalent NKp30 addressing molecules is enhanced compared to monovalent NKp30 × EGFR binding NKCEs and augmented by concomitant FcγRIIIa activation. Standard 4 h chromium release assays were performed with A431 (left graphs) and A549 cells (right graphs) cells and NK cells from healthy donors as effector cells at an E:T ratio of 10:1 and increasing concentrations of (a) eff- or (b) eff+ VHH SEEDbodies. VHH1-containing molecules (B7-H6 competing NKp30 sdAb) are displayed as filled characters and with solid lines while VHH2-harboring (B7-H6 non-competing NKp30 binding sdAb) NKCEs are displayed as open characters and with dotted lines. Monovalent NKp30 engagers (mv, orange) were compared to bivalent NKp30 engagers (bv, blue). One-armed EGFR binding SEEDbodies lacking the NKp30 activating VHH sdAb (oa-hu225_SEEDbody eff-; oa-hu225_SEEDbody eff+) were used as controls and are shown in gray (eff- as open characters; eff+ as filled characters). Mean values ± SEM of 4 independent experiments with different donors are shown, *p < 0.05%, **p ≤ 0.01, ***p ≤ 0.001, mv vs. bv, two-way ANOVA with Šidák-test. EC50 values are summarized in table 2.
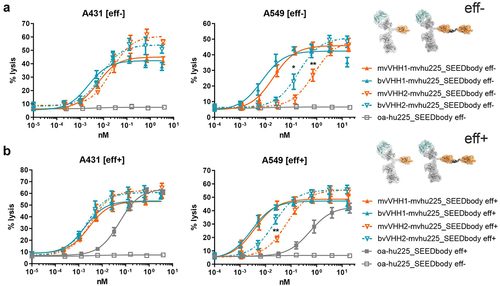
Table 2. Killing potencies of eff- vs. eff+ as well as mv vs. bv NKp30-targeting SEEDbodies monovalently engaging EGFR.
Figure 3. Bivalent NKp30 engagement increases killing potencies of bivalent EGFR binding NKCEs, outperforming cetuximab when concomitantly engaging FcγRIIIa. Cytotoxic capacities of the indicated NKCEs were measured in standard 4 h chromium release assays with A431 (left graph) and A549 (right graph) target cells and NK cells from healthy donors at an E:T ratio of 10:1. Increasing concentrations of the respective (a) eff- or (b) eff+ molecules fused with one (mv, blue) or two (bv, green) B7-H6 competing VHH1 (filled characters and solid lines) or non-competing VHH2 (open characters and dotted lines) sdAbs at the C-terminus of hu255_IgG or hu225_SEEDbody were used. One-armed eff- SEEDbody lacking the NKp30 activating VHH sdAb (oa-hu225_SEEDbody eff-, gray) and cetuximab (black) were used as controls. Mean values ± SEM of 4 independent experiments with different donors are shown, *p < 0.05%, **p ≤ 0.01, ***p ≤ 0.001, mv vs. bv, two-way ANOVA with Šidák-test. Killing potencies are summarized in table 3.
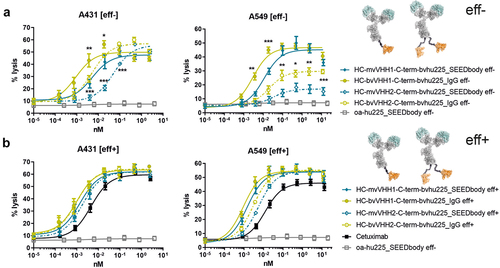
Table 3. Killing potencies of eff- vs. eff+ as well as mv vs. bv NKp30 targeting NKCEs bivalently binding EGFR.
Figure 4. Impact of VHH location on killing capacity differs depending on NKp30 binding epitope of the incorporated VHH. Standard 4 h chromium release assays were performed with A431 (left graphs) and A549 (right graphs) target cells and NK cells from healthy donors as effector cell population at an E:T ratio of 10:1 and increasing concentrations of the respective (a) eff- or (b) eff+ hu225_IgG antibodies. NKp30-specific VHHs were fused to the N- or C-terminus of the light chains (LC; N-term, pink; C-term, purple) or the C-terminus of the heavy chains (HC; C-term, ocher) employing two NKp30 binding sdAbs either competing with the natural ligand B7-H6 binding site (VHH1, solid lines) or not (VHH2, dotted lines). One-armed eff- SEEDbody lacking the NKp30 activating VHH (gray) and cetuximab (black) were used as controls. Mean values ± SEM of at least 3 independent experiments are shown. EC50 values are summarized in .
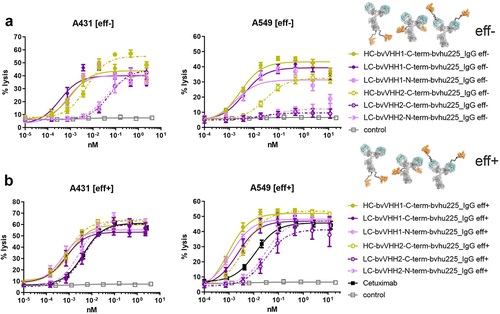
Table 4. Killing potencies of eff- vs. eff+ bivalent NKp30 × EGFR IgG-based NKCEs with differently located VHHs.
Figure 5. NKp30-specific eff+ NKCEs mediate release of immunomodulatory cytokines. Bivalent NKp30 × EGFR IgG-like eff+ NKCEs were compared with cetuximab (black) for their ability to induce NK cell-mediated TNF (upper graphs) and IFN-γ release (lower graphs). Differences in cytokine release between C-terminal HC (ocher), C-terminal LC (purple) as well as N-terminal LC (pink) fusions were determined for VHH1 (solid bars) and VHH2 (dotted bars) with (a) NK cells cocultured with EGFR-expressing A431 cells or (b) NK cells without any other cells for 24 h, respectively. Graphs show column bar plots ± SEM of 4 individual experiments.
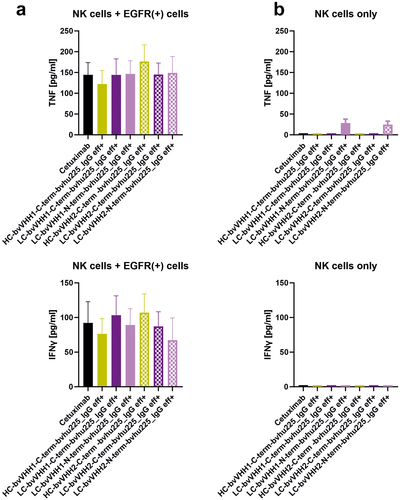
Figure 6. Bivalent NKp30 × EGFR targeting IgG-based NKCEs demonstrate significant ADCP and CDC activity. (a) Phagocytosis of EGFR-expressing MDA-MB-468 tumor cells was measured over 8 h by live cell imaging analyses using macrophages derived from healthy donors at an E:T ratio of 1:1 with 10 µg/ml eff+, bivalent EGFR-targeting hu225_IgG NKCEs carrying either VHH1 (left graph) or VHH2 (right graph) NKp30-engaging sdAbs. For both VHHs, the NKp30-directed paratopes were either fused C-terminally at the HC (ocher), C-terminally at the LC (purple) or N-terminally at the LC (pink). Reference proteins cetuximab and an IgG isotype control were included. Mean values of red object counts per image representing phagocytosed tumor cells ± SEM of 3 independent experiments are shown. (b) CDC of EGFR-expressing A431 tumor cells was measured in standard 3 h chromium release assays using human serum (25% v/v) from healthy donors in the presence of 10 µg/ml effector-functional (eff+) symmetric bivalent NKp30 × EGFR NKCEs employing either VHH1 (solid bars) or VHH2 (dotted bars) solely (left part of the graph) or in combination with 10 µg/ml matuzumab, a humanized IgG1 antibody targeting a non-cross-blocking epitope of EGFR (right part of the graph). Cetuximab in combination with matuzumab was included as positive control. Mean values ± SEM of 3 independent experiments are shown, *p < 0.05%, NKCE or cetuximab vs. w/o antibody, two-way ANOVA with Šidák-test.
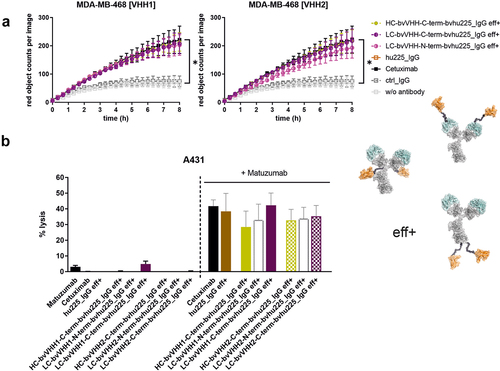
Figure 7. VHH location induce different pharmacokinetic profiles of bispecific EGFR x NKp30 NKCEs. Mouse plasma concentrations of bispecific eff+ NKCEs and cetuximab were measured over time after single intravenous administration of 3 mg/kg of the indicated molecules. Mean concentrations ± SEM of 3 specimen per sample are shown for cetuximab (black), HC-bvVHH1-bvhu225_IgG eff+ (ocher), LC-bvVHH1-N-term-bvhu225_IgG eff+ (pink) and LC-bvVHH1-C-term-bvhu225_IgG eff+ (purple) as determined by ELISA.
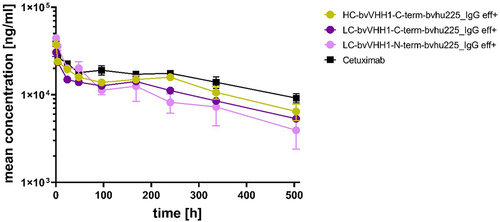
Table 5. PK properties of eff+ bivalent NKp30 × EGFR IgG-based NKCEs with differently located VHH in C57BL/6N mice. The percentage of extrapolated area under the curve (AUCinf) was generally high for total antibody and therefore AUCinf as well as clearance (CL) and volume of distribution at steady state (Vss) calculated using AUCinf should be considered cautiously. Half-life (t1/2) was derived from the 3 terminal data points.