Figures & data
Figure 1. Induction of inflammation in HEK-TLR4 cells. HEK-TLR4 cell cultures were treated with or without 100 ng/ml LPS to induce inflammation as described (see Methods). The Control cell cultures (left panel) were subsequently maintained in the dark in the incubator for 48 hours without further intervention. The Infra-Red treated cells (which included both LPS induced and non-induced cultures) were exposed to 720 nm Infrared light pulses for 10 minutes at 6 W/m2, at 12-hour intervals over a two day growth period(right panel). The inflammatory response (OD620/OD750) was quantified as the absorbance of the QUANTI-Blue SEAP substrate at 620 nm. normalized to the total protein concentration(absorbance at 750 nm)(see Methods). Infrared light was successful in reducing inflammation in LPS – stimulated (Grey Bars) but not unstimulated control cells (White Bars). Data are shown as the mean ± SE taken from five individual wells of one representative biological experiment
Figure 2. Effect of Infrared Light exposure on the HEK-TLR4 inflammatory response. The inflammatory response was induced in cell cultures by incubation with 100 ng/ml LPS and followed by exposure to 720 nm infrared illumination at the indicated intensities as described in Methods. The control condition represents inflammatory response of HEK-TLR4 cells exposed to 100 ng/ml LPS in the incubator with no exposure to infrared light. The decrease in the induced inflammatory response after exposure to IR light is expressed as a percentage of the Control. Data represent the mean ± SE of five independent experiments (N = 5). The asterisks indicate significance level of the differences: *p-value < 0.05 and **p-value < 0.01
Figure 3. Effect of low-level static magnetic field (LLF) and pulsed magnetic field (PEMF) on HEK-TLR4 inflammatory response. The inflammatory response is shown after incubation with 100 ng/ml LPS and exposure to PEMF condition (10 Hz PMF) or LLF condition for 10 min/12h for 48h (N=4; 10 Hz LLF) or continuously for 48h (N=5; 48h LLF) in comparison to the Control (magnetic field inside the incubator of 40mT) for each condition (Control PMF, Control LLF). The Control condition represents the inflammatory response of HEK-TLR4 induced by 100 ng/ml LPS, after 48 hours growth in the incubator at the local geomagnetic field with no exposure to LLF (see methods). The sham for PEMF and LLF conditions (See methods) also present and they have no significantly different when compared to their Control conditions. Data are shown as mean ± SE. The asterisks indicate significance level of the differences: *p-value < 0.05
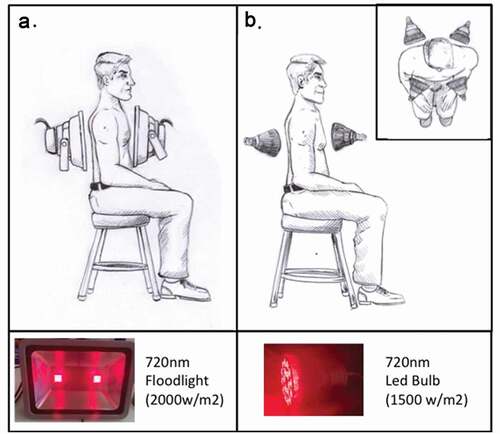
Figure 4. Model for the possible application of Infrared Light in the treatment of lung inflammation. LED light sources of the necessary 720 nm wavelength and light output intensity (achieving an intensity of 1000 W/m2 at the skin surface) can be applied either in the form of A. Two Floodlights (left panel) or as B. Four High Output LED Bulbs (right panel) (see Methods for specifications and origin of light sources). To provide the required 10 minute light pulses to the inflamed lung tissues at the necessary light intensity, these lamps should be positioned on both sides of the chest cavity and illuminated simultaneously to achieve maximum light penetration. The distance from the lamps to the skin surface should not exceed 5-10 cm to achieve the necessary intensity of at least 1000 W/m2 at the skin surface. Temperature at the skin surface using the two 720 nm Infrared Light sources does not increase beyond 5° above the ambient temperature during 10 minutes continuous illumination