Figures & data
Figure 1. Diagram of Experimental Setup. Top: Image of the transmitting antenna. The structure is printed on a Kapton Polyimide substrate. The final optimized design is fabricated by inkjetting a conductive ink based on silver nano-particles by a material printer. Bottom: Placement of antennae in incubator. The transmitting antenna was positioned at 30 centimeters above the sample within the incubator (central square panel). The measuring antenna was placed at the sample position for measurement before and after the experiment. The spectrum analyzer and signal generator were located outside of the incubator.
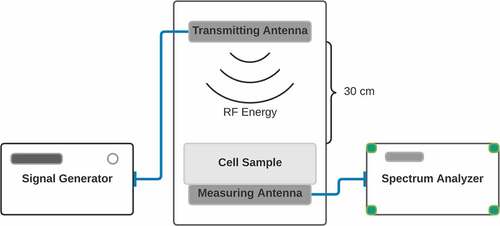
Table 1. Primer sequences
Figure 2. Production and subcellular localization of ROS by HEK cells exposed to RF. Living HEK cells were exposed or not to RF during 15 min and simultaneously treated with DCFH-DA [5-(and-6)-chloromethyl-2’,7’-dichlorofluorescein diacetate] and viewed by an inverted Leica TCS SP5 microscope. A: Images (a) to (h) show single confocal z section that cross the nucleus. Diffused fluorescent ROS staining can be seen in nucleus and cytoplasm at low, medium and high RF intensity. At medium and high RF intensity, additional vesicular and intense fluorescent ROS staining colocalizes perfectly with ER observed around the nucleus by differential interference contrast (D. I. C.). Scale bar 20 μm. B: Fluorescence intensities were measured cell by cell on z projected images, average values were normalized to the control condition (RF off) and shown as mean ± SD. Statistical analysis were performed as described (methods), n = 4. (** p < 0,01).
![Figure 2. Production and subcellular localization of ROS by HEK cells exposed to RF. Living HEK cells were exposed or not to RF during 15 min and simultaneously treated with DCFH-DA [5-(and-6)-chloromethyl-2’,7’-dichlorofluorescein diacetate] and viewed by an inverted Leica TCS SP5 microscope. A: Images (a) to (h) show single confocal z section that cross the nucleus. Diffused fluorescent ROS staining can be seen in nucleus and cytoplasm at low, medium and high RF intensity. At medium and high RF intensity, additional vesicular and intense fluorescent ROS staining colocalizes perfectly with ER observed around the nucleus by differential interference contrast (D. I. C.). Scale bar 20 μm. B: Fluorescence intensities were measured cell by cell on z projected images, average values were normalized to the control condition (RF off) and shown as mean ± SD. Statistical analysis were performed as described (methods), n = 4. (** p < 0,01).](/cms/asset/a247fbcd-1a34-4aeb-8053-33728bbacad7/kcib_a_2027698_f0002_oc.jpg)
Figure 3. qPCR gene expression analysis of genes implicated in control of cellular ROS. HEK Cell cultures were exposed for 15 min to Control (background): −96 dBm; High: −8.5 dBm; Medium: – 31 dBm; Low: – 55 dBm; Very Low: – 67 dBm signal amplitudes. Gene expression was normalized to the Control (unexposed) conditions; statistical analysis was performed by ANOVA comparison of the exposed (High and Medium RF amplitude) to the Control (unexposed condition). Data are shown as mean ± SE of three independent experiments (N = 3). A – F. Expression of the indicated seven genes were compared at different amplitudes. Statistical analysis was performed as described (Methods). Significance level of the differences are as follows: *p-value < 0.1; ** p-value < 0.01; *** p-value < 0.01.
Figure 4. qPCR gene expression analysis in HEK392 cells in response to 1.8 GHz or static magnetic field exposure. A. Cell cultures were exposed to 15 min at the indicated amplitudes of 1.8 GHz RF field prior to harvest and RNA expression analysis (methods). Gene expression was normalized to the Control (unexposed) conditions; statistical analysis was performed by ANOVA comparison of the exposed (High and Medium RF amplitude) to the Control (unexposed condition). Data are shown as mean ± SE of six independent experiments (N = 6). B. Cell cultures were exposed to 15 minutes of either Low Level magnetic field (0.2µT) or to a Pulsed Electromagnetic Field prior to harvest and RNA expression analysis (methods). Gene expression was normalized to the Control condition; statistical analysis was performed by ANOVA comparison of the exposed (LLF and PEMF field) to the Control (unexposed condition). Data are shown as mean ± SE of three (LLF; N = 3) or six (PEMF; N = 6) independent experiments. The asterisks indicate significance level of the differences: *p-value < 0.1; ** p-value < 0.01; *** p-value < 0.01.
Figure 5. qPCR gene expression analysis of RF signal amplitude dependence. Cell cultures were exposed for 15 m to Control (background): −96 dBm; High: −8.5 dBm; Medium: – 31 dBm; Low: – 55 dBm; Very Low: – 67 dBm signal amplitudes. Gene expression was normalized to the Control (unexposed) conditions; statistical analysis was performed by ANOVA comparison of the exposed (High and Medium RF amplitude) to the Control (unexposed condition). Data are shown as mean ± SE of three independent experiments (N = 3). A – G. Expression of the indicated seven genes were compared at different amplitudes. Gene expression was normalized to the Control condition; statistical analysis was performed by ANOVA comparison of the different exposed (High, Medium, Low, or Very Low) to the Control (unexposed condition). The asterisks indicate significance level of the differences: *p-value < 0.1; ** p-value < 0.01; *** p-value < 0.01.