Figures & data
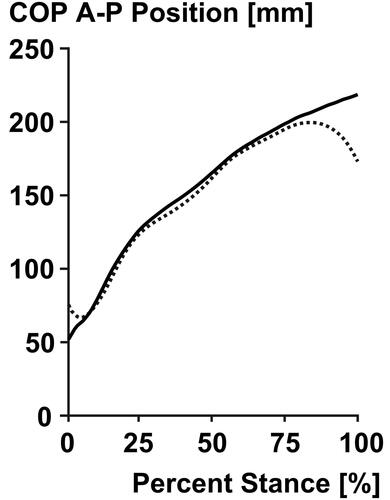
Figure 1. Schematic illustration of the teeter-totter effect including the applied force of the runner (solid arrow) at the forefoot, the reaction force at the mid-rearfoot (hollow arrow) and the pivot axis (black dot) during two time-points in stance phase. This is not a free body diagram.
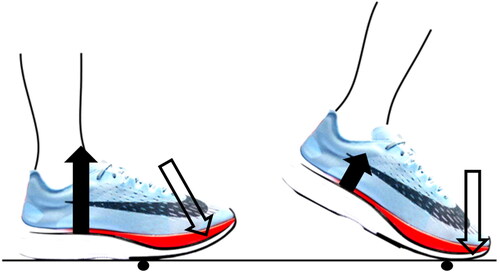
Figure 2. Mean (n = 8 steps) centre of pressure (COP) a–p position for one subject running in the Nike Vaporfly 4% shoe on the treadmill (solid line) and overground (dashed line) at a constant speed of 3.8 m/s.