
Figures & data
Table 1. Promising climate change mitigation measures based on successful implementation (Dagnachew et al. Citation2021; van Soest et al. Citation2021).
Table 2. Scenario descriptions (Dagnachew et al. Citation2021).
Figure 1. GHG emissions of mitigation pathways compared to 2015 and current policy scenario in 2050. This figure shows the result of the model assessment of the emission reduction potentials of the various measures in eleven world regions. It shows sectoral emissions in 2015 and in 2050 for two scenarios, the current policies scenario and either the bridge scenario (Europe, North America, and Japan & Korea) or the good practice policies scenario (all other regions). The difference in emissions between the current policies and the mitigation scenario provides an indication of the sectoral mitigation potential in that region.
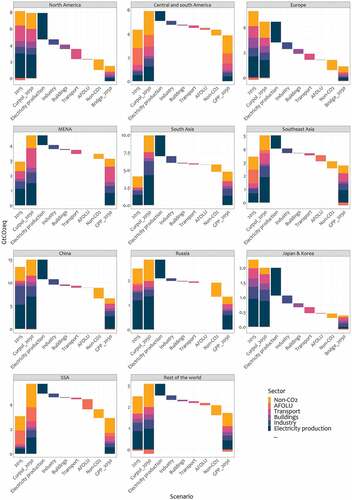
Figure 2. Contribution of sectors to GHG emission reduction under GPP and Bridge scenarios in 2050. The figure demonstrates that the sectors with the top three highest climate change mitigation potentials represent 75–95% of the emission reduction potential of the region.
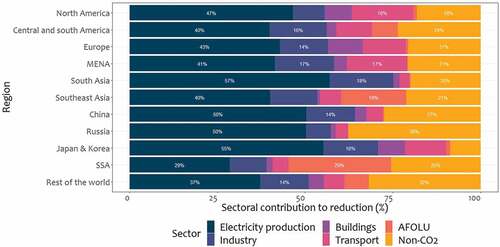
Figure 3. Co-benefits and trade-offs between climate change mitigation measures and SDGs by region. The figure presents the co-benefits and trade-offs aggregated by sector based on tables in SI_03. The scoring is done as follows; 2 points when the potential benefits outweigh the trade-offs, 1 point when there are more potential co-benefits than potential trade-offs, +1 and −1 points when the potential co-benefits and the potential trade-offs are about equal and −1 points when there are more potential trade-offs than potential co-benefits. The figure shows that in each region, there are considerably more co-benefits than trade-offs.
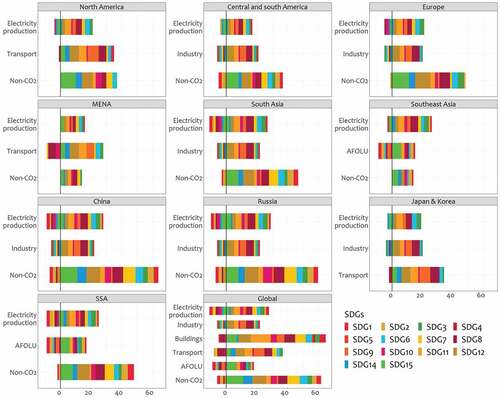
Table 3. Summary table of synergies and trade-offs between climate change mitigation measures and SDGs.