
Figures & data
Figure 1. Classroom view from the background camera in the virtual classroom.
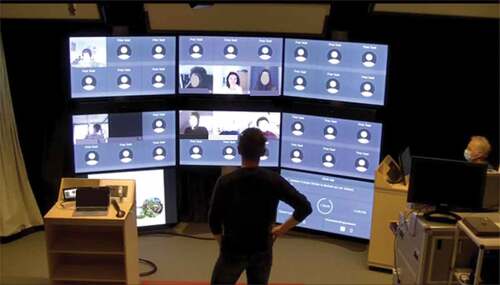
Table 1. Overview of students’ (N = 13) study background.
Figure 2. Coding process.
Table 2. Means and Standard Deviations for student experience (N = 13).
Table 3. Means and standard deviations for students’ prior knowledge.
Table 4. Means and standard deviations for items on the transactional distance scale (N = 13) after 7 weeks.
Table 5. Means and standard deviations for items on the presence scale (N = 13) after 7 weeks.
Table 6. Types of interdisciplinary competences mentioned in 14 student papers.
Table 7. Number of strengths and weaknesses reported in 15 student reflection papers.
Data availability statement
The data that support the findings of this study are available on request from the corresponding author, J.Kasch. The data are not publicly available due to them containing information that could compromise the privacy of research participants.