
Figures & data
Figure 1. Weather data for Mymensingh’s muktagacha (2021–22; December-June); column graph indicates the amount of rainfall (mm) in the primary axis, while the line graph demonstrated the maximum and minimum temperature (red; maximum, blue; minimum) with secondary axis.
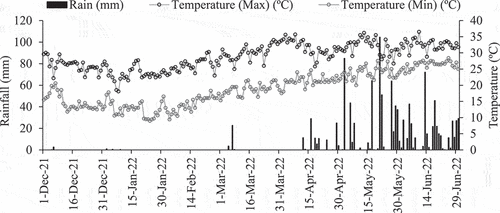
Figure 2. Time course ± SE of N2O emissions in response to (a) different levels of residue and (b) N fertilizer rate in maize field; crop residue retention = CR and No residue = NR; FP = farmers’ practice, RD = recommended dose, 1.25 RD = 125% of recommended dose; arrows indicate the day of split urea application.
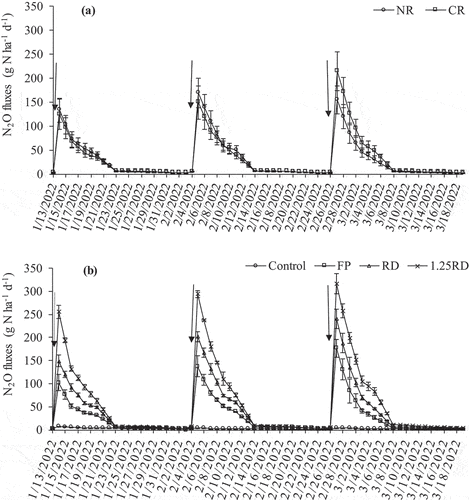
Table 1. Interaction effect of crop residue and different N fertilization rates on mean, cumulative N2O emissions and the emission factor (EF%) in maize field (n = 3; mean ± SE).
Table 2. Interaction effect of crop residue and different N fertilization rates on soil SOC, TN, P, K, S content and pH (n = 3; mean ± SE).
Table 3. Estimated coefficients of physico-chemical properties selected as significant explanatory variables using a stepwise procedure for the model of N2O emissions (n = 24).
Figure 3. Interaction effect of crop residue and different N fertilization rates on maize yield; crop residue retention = CR and No residue = NR; FP = farmers’ practice, RD = recommended dose, 1.25 RD = 125% of recommended dose; bars with different letters vary significantly from each other at p < 0.05.
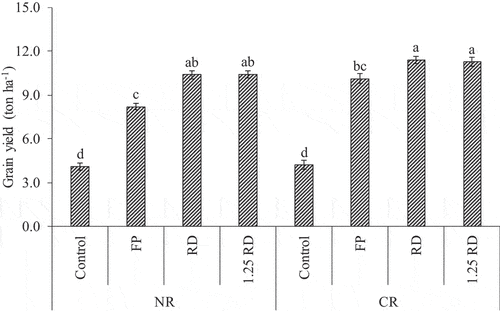
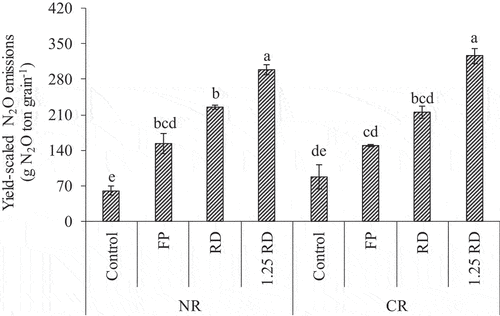
Figure 4. Interaction effect of crop residue and different N fertilization rates on yield-scaled N2O emissions in maize field; crop residue retention = CR and No residue = NR; FP = farmers’ practice, RD = recommended dose, 1.25 RD = 125% of recommended dose; bars with different letters vary significantly from each other at p < 0.05.
Data availability statement
The authors agree to make data and materials supporting the results or analyses presented in their paper available upon reasonable request.