Figures & data
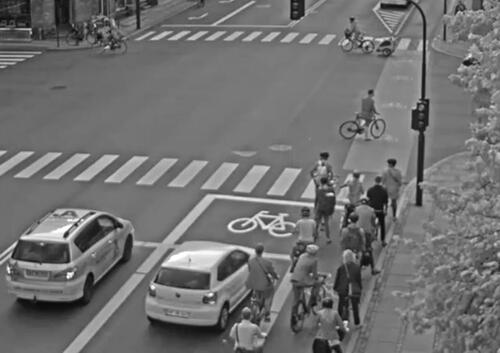
Figure 1. Advanced stop box (red marking). Cyclists use the ASB to position in front of vehicles during the red-signal phase.
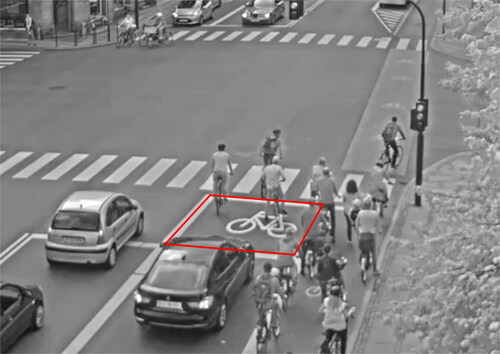
Figure 2. Left turn. Cyclists in Denmark must do a two-stage left turn (green, dashed line) instead of turning like vehicles (red, dotted line).
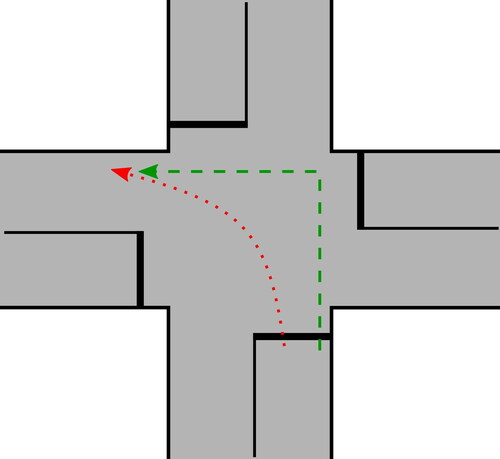
Figure 3. Study sites. Intersections before and after ASBs were established.
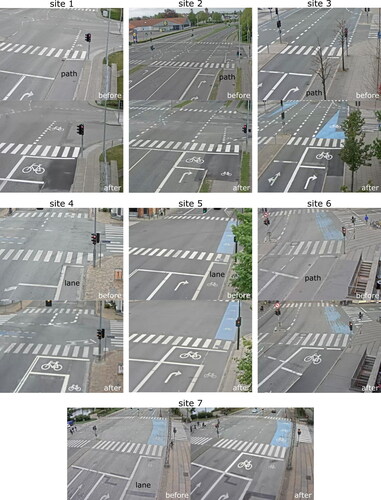
Table 1. Characteristics of the seven study sites. AADTs and ASB usage rates were estimated based on manual counts of a sample of the collected data.
Figure 4. Camera setup for collection of video footage. Existing lighting poles were used where possible (left). Alternatively, a mobile pole (right, sites 3, 4, 6 and 7) was used to ensure a good camera position.
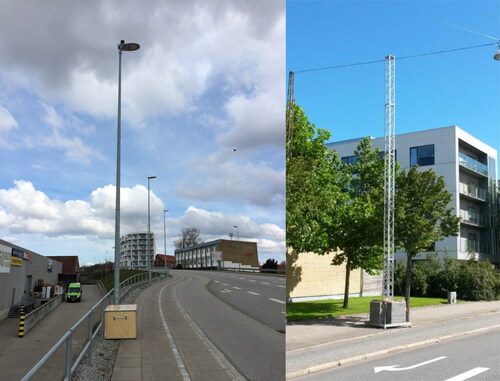
Figure 5. Procedure for data analysis. For an explanation of each step, see text.
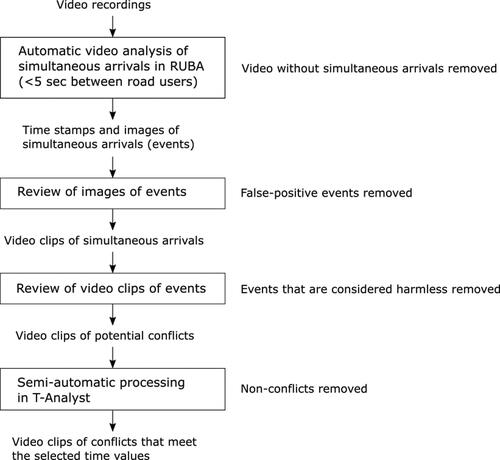
Figure 6. Detection of potential conflicts in RUBA. If both fields are triggered at approximately the same time, RUBA registers the situation as a potential conflict, subject to further analysis.
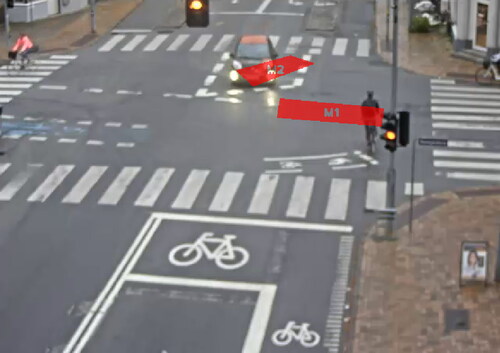
Figure 7. Trajectories of road users involved in potential conflicts were created manually via T-Analyst.
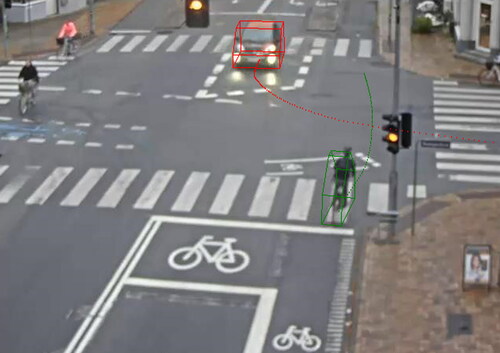
Table 2. Number of conflicts, length of recordings per site and change in bicycle flows from before to after.
Table 3. Conflict rates (CR) and conflict rate ratios (CRR), adjusted for changes in bicycle flows in the after-period, for conflicts between turning vehicles and cyclists. * denotes that the CRR differs significantly from 1 at the 5% level.
Figure 8. ASB not in use. Cyclists in the front block the entry to the ASB for the other cyclists.