Figures & data
Table 1. Number of observations (n), mean (ng g–1), standard error of mean (SE), variance, minimum, median (Q50), 95% quantile (Q95) and maximum values for acrylamide in samples of potato crisps from 2002 to 2011.
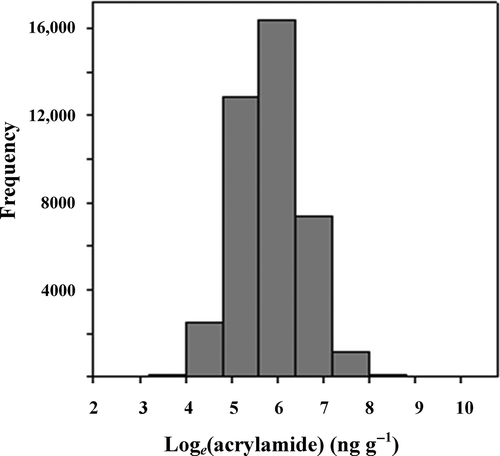
Figure 1. Distribution (histogram) of the loge(acrylamide) values (ng g−1) in samples of potato crisps.

Table 2. Mean acrylamide (ng g–1) on the natural log (to base e) scale in samples of potato crisps for each year from 2002 to 2011, with number of observations (n).
Table 3. Least significant difference (LSD) values on 40,445 degrees of freedom at the 5% (p < 0.05) level of significance, from analysis of variance of acrylamide in samples of potato crisps from 2002 to 2011.
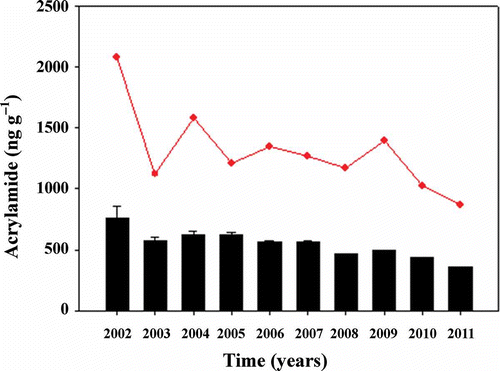
Figure 2. Overall mean acrylamide levels (ng g−1) in samples of potato crisps shown over years from 2002 to 2011, with standard errors and with trend in 95% (Q95) quantiles (red).

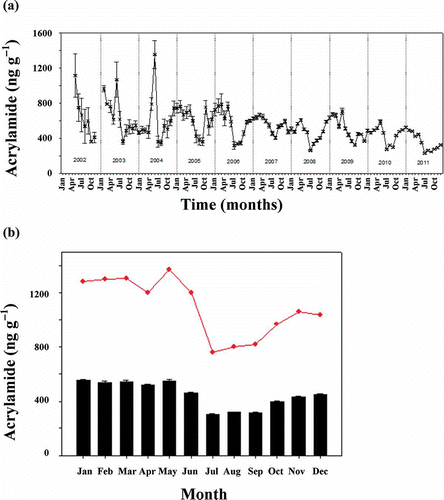
Figure 3. Seasonality in acrylamide levels in samples of potato crisps from 2002 to 2011. (a) Mean acrylamide levels over time (2002–2011) with standard errors, plotted monthly. (b) Mean acrylamide levels per month over all years with standard errors and with trend in 95% (Q95) quantiles (red).

Table 4. Number of observations (n), mean (ng g–1), standard error of mean (SE), median (Q50) and 95% quantile (Q95) values for acrylamide in samples of potato crisps for each month using data from 2002 to 2011.
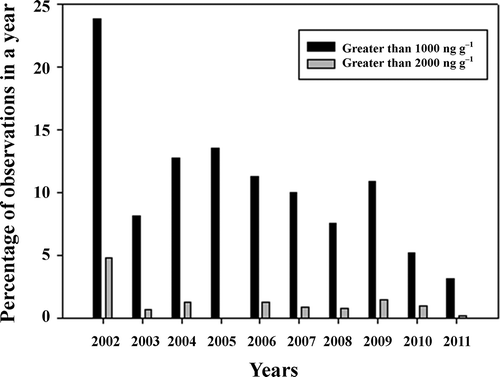
Figure 4. Percentage of samples of potato crisps in each year from 2002 to 2011 containing >1000 or 2000 ng g−1 acrylamide.

Table 5. Number and percentage of potato crisp samples containing more than 1000 or 2000 ng g–1 acrylamide for each year from 2002 to 2011.