
Figures & data
Table 1. Theoretical peptides of simulated tryptic digestion and detectable peptides using UPLC-TOF.
Table 2. MRM parameters of the precursor ion, product ion, cone voltage, collision energy and type of fragment for each candidate signature peptide and ISs.
Figure 1. MRM chromatograms of the quantitative product ion spectra from the selected precursors of the target peptides with the signal-to-noise ratio, from top to bottom: DMPIQAFLLYQEPVLGPVR, GPFPIIV, EMPFPK, VLPVPQK and AVPYPQR.
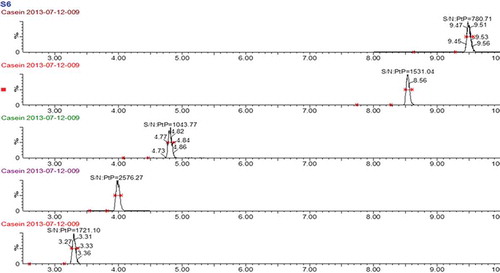
Figure 2. Comparison of the relative peak areas normalised to a standard of IS1, IS3 and a signature peptide in different food matrices (n = 3). A total of 10 µg ml–1 bovine β-casein solution and 1:100 diluted human milk were digested respectively and combined with 0.25 µg ml–1 IS1 solution at the ratio of 1:1:1 (v/v/v) to form a digest mixture. The negative sample and commonly used baking ingredients (wheat flour, sugar, salt, peanut oil, hen’s eggs, cacao and coconut) were treated identical with human and bovine β-casein with trypsin, and mixed in a ratio of 1:1 (v/v) with the digest mixture. The standard solution was prepared by mixing the digest mixture and water in the ratio of 1:1 (v/v), and its peak area was set as 100% abundance.
Figure 3. Relative peak areas normalised to a signature peptide standard and IS1, IS2 in different food matrices (n = 3). A total of 0.1 g negative sample and commonly used baking ingredients (wheat flour, sugar, salt, peanut oil, hen’s eggs, cacao and coconut) were weighed into the Eppendorf caps and mixed with 100 µl of 10 µg ml–1 bovine β-casein. After spiking of 10 µl IS1 (0.25 µg ml–1) and IS2 (1 µg ml–1) into the caps, the mixtures were digested as described in the ‘Tryptic digestion and peptide extraction’ section. The solutions of bovine β-casein and ISs at the same concentration were digested as a standard, and its peak area was set as 100% abundance.
Figure 4. Recoveries of extraction and suspension digestion: black, suspension digestion; and white, extraction digestion (n = 3).
Table 3. Comparison of recovery obtained with the different extraction method.