
Figures & data
Table 1. Investigated analytes in serum and urines from veal calves (n = 24) of the ‘unknown’ group.
Table 2. Serum biomarker values from veal calves in the control group (n = 50).
Table 3. Serum biomarker values from veal calves in the unknown group (n = 421).
Figure 1. Distribution of the Mahalanobis distance (log values) for Group C and Group U animals. Blue figures = Group C; green figures = Group U, compliant animals; and red figures = Group U, non-compliant animals.
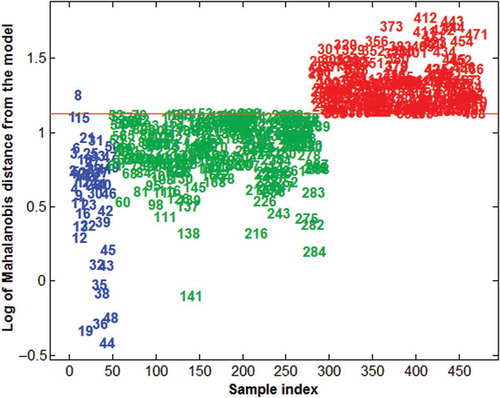
Figure 2. (colour online) Flow chart of the study.
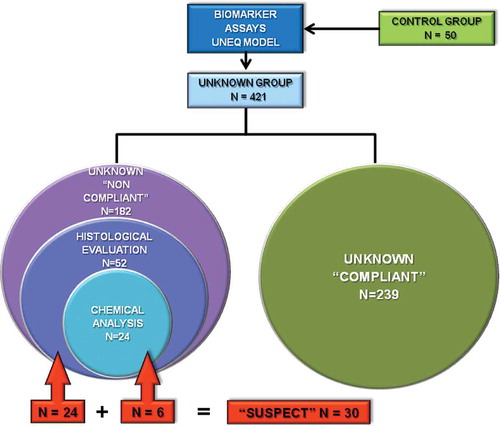
Table 4. Results of the histological evaluation (n = 52) and chemical analysis (n = 24) of selected samples from the ‘unknown veal calves’ group classified as ‘non-compliant’ with respect to the UNEQ class model based on the levels of five serum biomarkers.