
Figures & data
Table 1. FoodEx Categories used in model and example of food consumption data – for Danish adults (g day–1).
Figure 1. Distribution of PUFA levels in fine bakery wares.
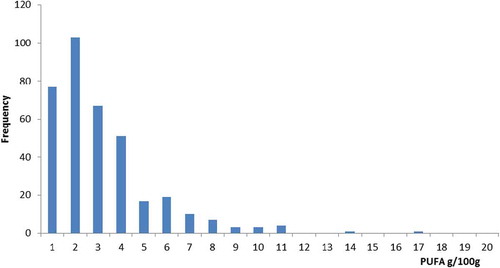
Table 2. PUFA intakes developed and used in model.
Table 3. Qualitative evaluation of influence of uncertainties on FEDIOL exposure model.
Supplemental material