
Figures & data
Table 1. Number of meat, milk and eggs samples tested (ntotal) and numbers (n) exceeding one or both maximum levels (MLs) for PCDD/Fs or the sum of PCDD/Fs and DL-PCBs, according to 1881/2006/EC (expressed as pg TEQWHO1998 g−1 fat).
Table 2. Number of meat, milk and eggs samples tested (ntotal) and numbers exceeding one or both action levels (AL) for PCDD/Fs or DL-PCBs according to 2006/794/EC (expressed as pg TEQWHO1998 g−1 fat).
Table 3. Distribution of mean lower and upper bound levels of PCDD/Fs and DL-PCBs (in pg TEQWHO2005 g−1 fat) based on pooled quarterly (PQ) samples from 2001–2009.
Figure 1. Frequency distribution of the levels of PCDD/Fs and DL-PCBs in (A) beef (n = 50) and (B) chicken (n = 65) using EU monitoring samples. Both lower and upper bound levels are shown, as well as the P50 (median) and P95 levels of both distributions (expressed in pg TEQWHO2005 g-1 fat).
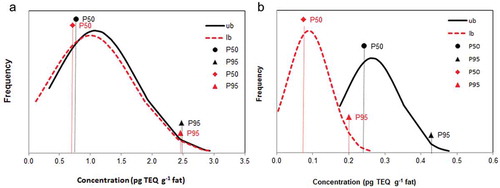
Table 4. Distribution of upper bound PCDD/F, DL-PCB and total TEQ levels of Dutch EU monitoring data (2004–2011) and EFSA data (Citation2010). Levels in pg TEQ g−1 fat, based on WHO-TEFs2005 and compared with ALs/MLs applied since 2012.
Figure 2. Variability of the mean levels of PCDD/Fs and DL-PCBs in (A) beef EU monitoring samples, (B) beef PQ samples, (C) EU monitoring samples chicken, and D) EU monitoring samples milk. Both lower [lb] and upper [ub] bound mean levels are presented, as well as the highest/lowest values per year (expressed in pg TEQWHO2005 g-1fat).
![Figure 2. Variability of the mean levels of PCDD/Fs and DL-PCBs in (A) beef EU monitoring samples, (B) beef PQ samples, (C) EU monitoring samples chicken, and D) EU monitoring samples milk. Both lower [lb] and upper [ub] bound mean levels are presented, as well as the highest/lowest values per year (expressed in pg TEQWHO2005 g-1fat).](/cms/asset/48092bee-88d0-4a9d-881b-d6e2c111b9c8/tfac_a_1252065_f0002_b.gif)
Figure 3. Effect of the new lower reporting limits on the lower (A) and upper bound (B) PCDD/F levels in individual milk samples from 2007, 2008 and 2009 (using WHO-TEFs 2005).
Table 5. Effect of the reduction of LOQs on the median lower and upper bound levels for PCDD/Fs and the total TEQ in EU monitoring samples from 2007, 2008 and 2009 (expressed in pg TEQWHO2005 g−1 fat).