
Figures & data
Figure 1. Structural formula of aristolochic acids (AAs).
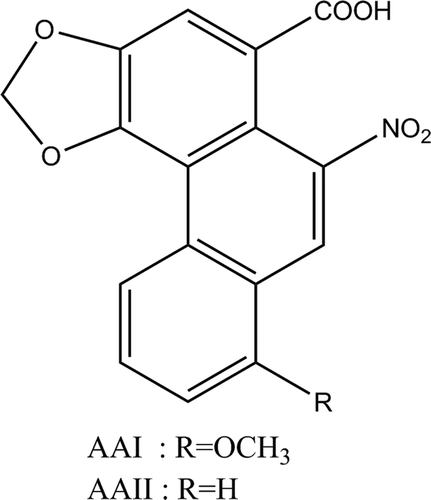
Table 1. Product description of the PFS analysed in the present study.
Figure 2. Total number of plant food supplements and other herbal products containing AAs (a) and percentage of positive samples (means ± SD) (b) over the years. The details of each study are presented in the supplemental data online.
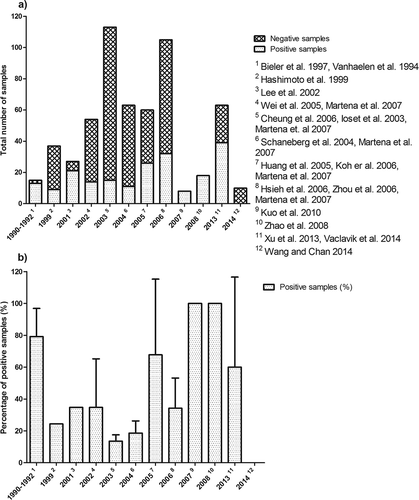
Table 2. Levels of aristolochic acid I (AAI) and aristolochic acid II (AAII) in positive samples of PFS (n = 3 independent analyses).
Figure 3. UPLC chromatogram of the methanol extract of sample S2 (declared to contain Aristolochia clematitis). Peaks marked with an asterisk (*) were not identified. The chromatogram was obtained at a wavelength of 240 nm.
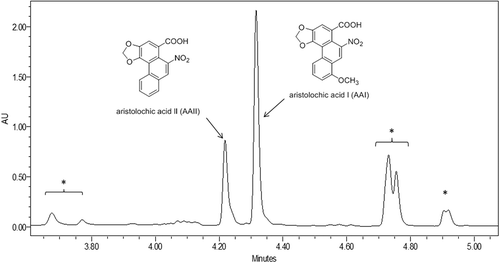
Table 3. Estimated daily intakes (EDIs) of AAs.
Table 4. Results from a BMD analysis of the data for kidney tumour formation in rats (Mengs et al. Citation1982) exposed to AAs using BMDS software version 2.5, a BMD of 10% and default settings based on assumption of equal potency of AAs.
Table 5. MOE values of AAs resulting from the consumption of PFS.
Figure 4. Number of samples with respective MOE values assuming a lifetime or 2 weeks of exposure to AAs based on samples analysed in the present study and reported in the literature. The MOE was calculated by dividing the lowest BMDL10 of AAs of 10 µg kg–1 bw day–1 for kidney tumour formation by the EDI of AAs from the PFS and other herbal products.
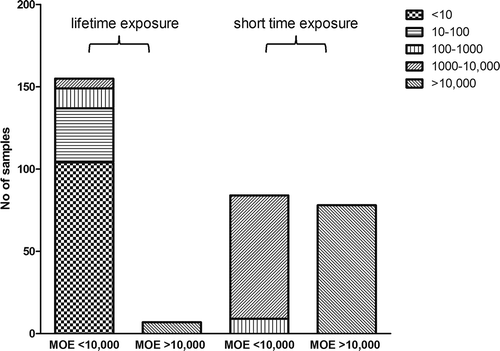
Table 6. DNA adduct formation in the kidney of rats exposed to either AAI, AAII or a mixture of AAs obtained from the literature.