Figures & data
Table 1. Calculated EC50 values for the effect of lipophilic marine biotoxins on the viability of murine neuroblastoma neuro-2a cells, and murine neuroblastoma x rat glioma hybrid NG108-15 cells, the resulting TEF values in the neuro-2a assay, and recommended TEFs by FAO/WHO and EFSA.
Table 2. LC-MS/MS determined levels of lipophilic marine biotoxins in 16 naturally contaminated shellfish samples compared to the outcome of the neuro-2a assay. Samples (S1-S8) were mixed samples used for the validation of the LC-MS/MS method.
Table 3. Effect of Chilean seafood extracts on the viability of neuro-2a cells and levels of lipophilic marine neurotoxins measured by LC-MS/MS.
Figure 1. Effect of several lipophilic marine biotoxins on the viability of neuro-2a cells as measured with the MTT assay compared to the average of the solvent control (0.25% DMSO): (a) OA: okadaic acid; DTX-1, DTX-2: dinophysistoxin −1, −2; PTX-2: pectenotoxin-2; (b) AZA-1, AZA-2, AZA-3: azaspiracid −1, −2, −3; YTX: yessotoxin; hYTX: 1a homo yessotoxin. Data are expressed as mean ± SD (n = 3).
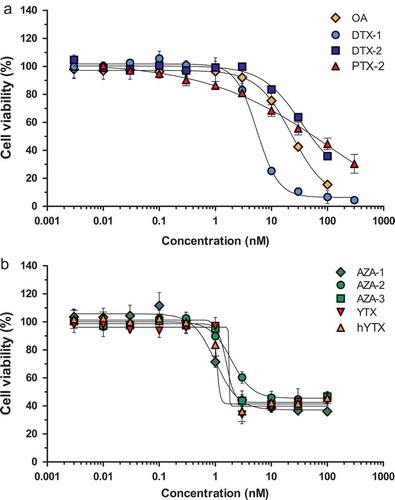
Figure 2. Effect of the introduction of an additional n-hexane wash step in the sample extraction procedure: (a) undiluted and 10-fold diluted sample extracts of blank mussel samples prepared without the n-hexane wash step; (b) undiluted and fivefold diluted sample extracts of blank mussel samples prepared by introducing the n-hexane wash step. ADL is the ‘arbitrary’ decision limit, set at 75% cell viability. Data are expressed as mean ± SD (n = 3).
Figure 3. Mussel samples spiked at 3, 1 and 1/3 times the maximal permitted levels (MPLs) of 160 µg kg–1 for OA, DTX-1 and AZA-1, and at about 1/4 MPL for YTX, i.e. 1000 µg kg–1, extracted with the procedure including the extra n-hexane wash step and analysed in the neuro-2a assay. An ‘arbitrary’ decision limit (ADL) of 75% was used. Positive control: DTX-1 12nM. Data are expressed as mean ± SD (n = 3).
Figure 4. Effect on the viability of neuro-2a cells (as measured with the MTT assay) of: (a) shellfish products (validation samples S1–S8) contaminated with okadaic acid/dinophysistoxins, yessotoxins and/or azaspiracids () and three blank shellfish samples (samples 9–11); (b) eight mussel samples (1–8) naturally contaminated with detectable levels of one or more LMBs (). An ‘arbitrary’ decision limit (ADL) of 75% was used and 0.25% DMSO was included as a control in each experiment. Data are expressed as mean ± SD (n = 3).
Figure 5. Effect of extracts of 48 seafood products obtained from Chile and both positive and blank mussel sample controls, on the viability of neuro-2a cells as measured with the MTT assay. Positive sample control: mussels naturally contaminated with YTX. The decision limit was ‘arbitrarily’ set at 75% viability (ADL) and 0.25% DMSO was included as a control. Data are expressed as mean ± SD (n = 3).