Figures & data
Table 1. Analysis of variance of acrylamide data for samples of potato crisps from Europe 2002 to 2016 to show differences between years.
Table 2. Acrylamide in samples of potato crisps from 2002 to 2016: Mean (ng g−1), standard error of mean (SE), number of observations (n), 90% and 95% quantiles (Q90 and Q95), maximum levels, and proportion (%) of samples containing greater than 1000 or 2000 ng g−1..
Figure 1. Overall mean acrylamide levels (ng g−1) in samples of potato crisps shown over years from 2002–2016, with standard errors and with trend in 90% and 95% quantiles.
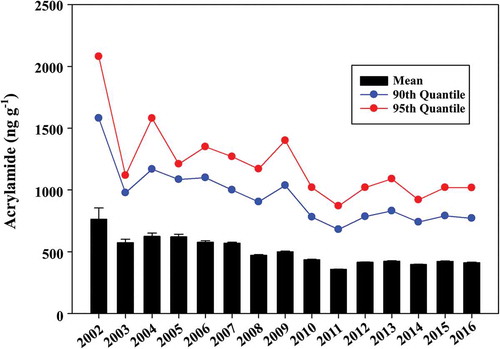
Figure 2. Proportion (%) of samples of potato crisps in each year from 2002 to 2016 containing more than 1000 (top) or 2000 ng g−1 (bottom) acrylamide.
Table 3. Number of observations (n), mean (ng g−1), standard error of mean (SE), 90% and 95% quantile (Q90 and Q95) values for acrylamide in samples of potato crisps from Europe for each month using data from 2002 to 2016. The Q90 and Q95 values are also given for the period from 2011 to 2016. Values other than n are shown in bold where they are greater than 1000 ng g−1..
Figure 3. Seasonality in acrylamide levels in samples of potato crisps from 2002–2016.
Top panel: mean acrylamide levels over time (2002–2016) with standard errors, plotted monthly. Bottom panel: mean acrylamide levels per month over all years with standard errors and with trend in 90% and 95% quantiles.
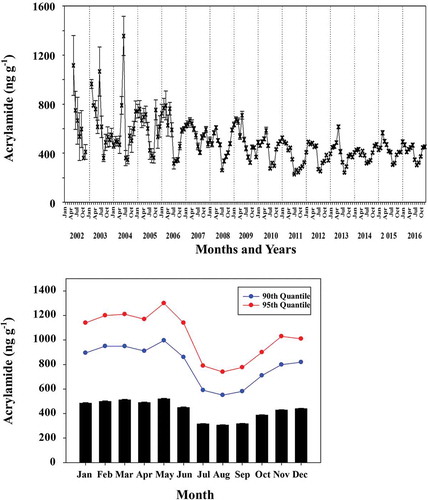
Table 4. Mean (ng g−1), standard error of mean (SE), number of values (n), mean of loge data, Q90, Q95 and maximum values of acrylamide by type and year in samples of potato crisps from Europe 2002 to 2016. Means are shown in bold where they are greater than 1000 ng g−1..
Figure 4. Overall mean acrylamide levels (ng g−1) in samples of potato crisps of different types (standard, thick cut and ridge/wave) shown over years from 2002–2016, on the loge scale showing the average LSD (5%) on 73,822 degrees of freedom (top) and on the raw scale with standard errors (bottom).
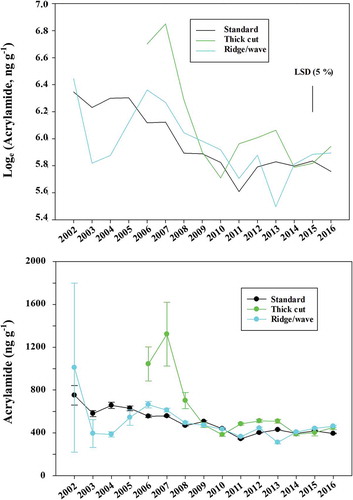
Table 5. Grouping of 25 European countries into geographic regions (north, south, east and west) that formed the basis of the regional analysis of acrylamide levels. Note that there were no observations from Estonia, Luxembourg, Malta or Slovenia in the dataset.
Figure 5. Overall mean acrylamide levels (ng g−1) in samples of potato crisps from different regions of Europe (north, south, east and west: ), shown over years from 2002–2016, on the loge scale showing the LSD (5%) on 73,813 degrees of freedom (top) and on the raw scale with standard errors (bottom).
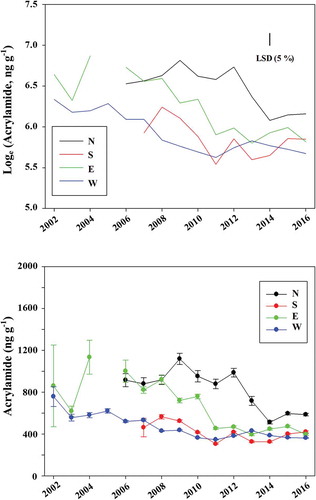
Table 6. Mean (ng g−1), standard error of mean (SE), number of values (n), proportion (%) of samples with more than 1000 ng g−1 and mean of loge data for acrylamide by region and year in samples of potato crisps from Europe, 2002 to 2016. Mean values are shown in bold where they are greater than 1000 ng g−1..
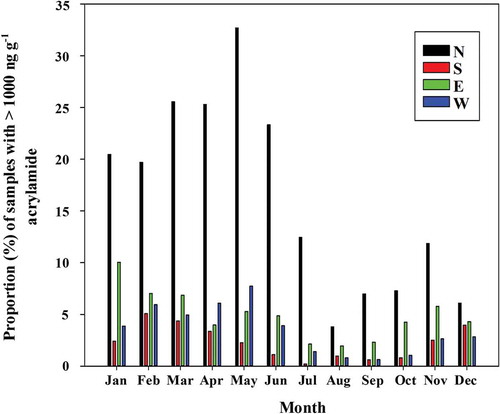
Figure 6. Proportion (%) of samples with more than 1000 ng g−1 acrylamide for each month over the period 2011–2016 for geographic regions.