

ABSTRACT
Detection of adulteration in carbohydrate-rich foods like fruit juices is particularly difficult because of the variety of the commercial sweeteners available that match the concentration profiles of the major carbohydrates in the foods. In present study, a new sensitive and robust assay using Fourier Transform Near-Infrared Spectroscopy (FT-NIRS) combined with partial least square (PLS) multivariate methods has been developed for detection and quantification of saccharin adulteration in different commercial fruit juice samples. For this investigation, six different commercially available fruit juice samples were intentionally adulterated with saccharin at the following percentage levels: 0%, 0.10%, 0.30%, 0.50%, 0.70%, 0.90%, 1.10%, 1.30%, 1.50%, 1.70% and 2.00% (weight/volume). Altogether, 198 samples were used including 18 pure juice samples (unadulterated) and 180 juice samples adulterated with saccharin. PLS multivariate methods including partial least-squares discriminant analysis (PLS-DA) and partial least-squares regressions (PLSR) were applied to the obtained spectral data to build models. The PLS-DA model was employed to differentiate between pure fruit juice samples and those adulterated with saccharin. The R2 value obtained for the PLS-DA model was 97.90% with an RMSE error of 0.67%. Similarly, a PLS regression model was also developed to quantify the amount of saccharin adulterant in juice samples. The R2 value obtained for the PLSR model was 97.04% with RMSECV error of 0.88%. The employed model was then cross-validated by using a test set which included 30% of the total adulterated juice samples. The excellent performance of the model was proved by the low root mean squared error of prediction value of 0.92% and the high correlation factor of 0.97. This newly developed method is robust, nondestructive, highly sensitive and economical.
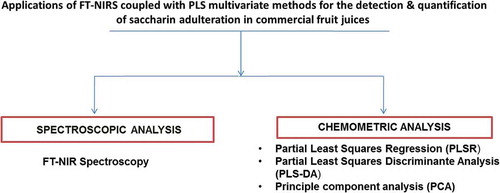
GRAPHICAL ABSTRACT
Disclosure statement
No potential conflict of interest was reported by the authors.