
Figures & data
Table 1. Finished and semi-finished food test samples; * contained same type of E171.
Figure 1. Raman spectra of pristine E171 starting sample materials (lower part) and rutile/anatase reference materials (upper spectra).
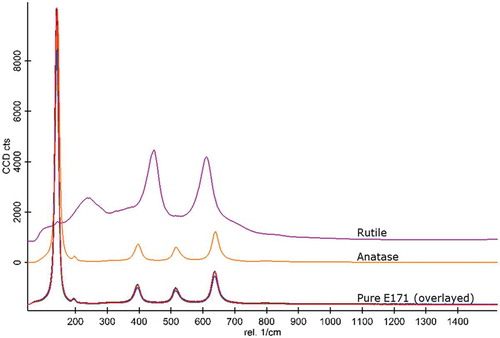
Figure 2. Transmission electron microscopy. Number-weighted size distributions of titanium dioxide particles in pristine E171 additives (starting materials) and extracted materials. Histograms of absolute frequency (counts) and cumulative functions.
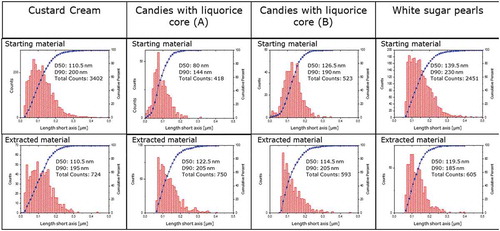
Figure 3. Transmission electron microscopy. Number-weighted size distributions of titanium dioxide particles in pristine E171 additives (starting materials) and extracted confectionery masses. Histograms of absolute frequency (counts) and cumulative functions.
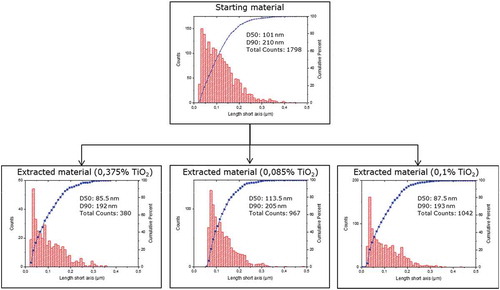
Table 2. TEM analysis: number of analysed particles, number-weighted mean size, D50 and relative frequency of particles in the nanoscale of pristine E171 additives and extracted particles.
Figure 4. TEM images of pearlescent pigment used in yellow sugar pearls. (a) Lower magnification of pigment, (b) higher magnification of pigment surface, (c) extracted material, (d) energy dispersive x-ray analysis. Spectrum belonging to sub-figure (B).
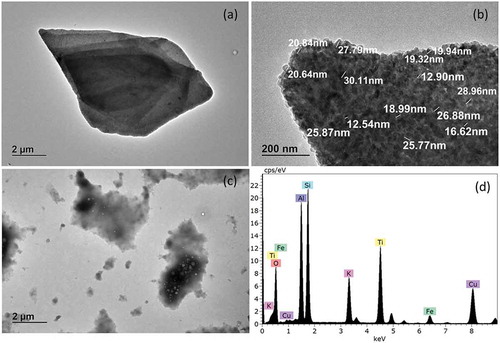
Figure 5. TEM images of titania particles and matrix residuals (highlighted) in candy extracts.
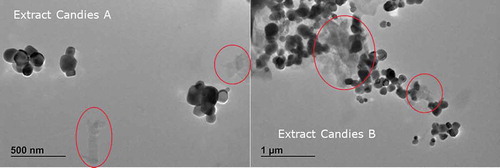
Figure 6. Single particle ICP-MS – cumulative number distribution of titanium dioxide particles of four E171 pristine starting materials and the extract of white sugar pearls. The legend includes the number of analysed particles.
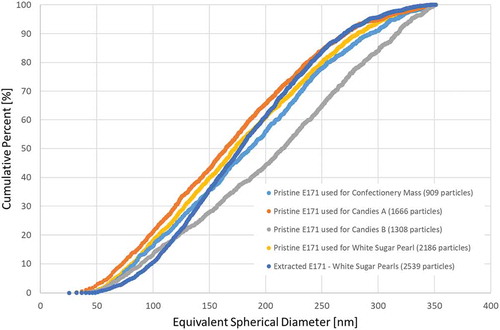
Table 3. Single particle ICP-MS analysis: number of analysed particles, median of the number-weighted size distribution and relative frequency of particles in the nanoscale of pristine E171 additives and particles extracted from white sugar pearls.
Figure 7. Size distributions determined with CLS. (a) Absorbance-based/extinction-weighted size distributions for E171 particles extracted from different food products, (b) absorbance-based/extinction-weighted size distributions for E171 particles extracted from Candies A (three replicate measurements), (c) mass-weighted size-distribution of particles extracted from Candies A, (d) number-weighted size-distribution of particles extracted from Candies A.
Table 4. Surface areas (SSA), volume-specific surface area (VSSA) and TEM-based VSSA estimation (VSSA TEM) determined for six pristine E171 additives.